
Taiwan vs Belgium: average net forest area change per year by period
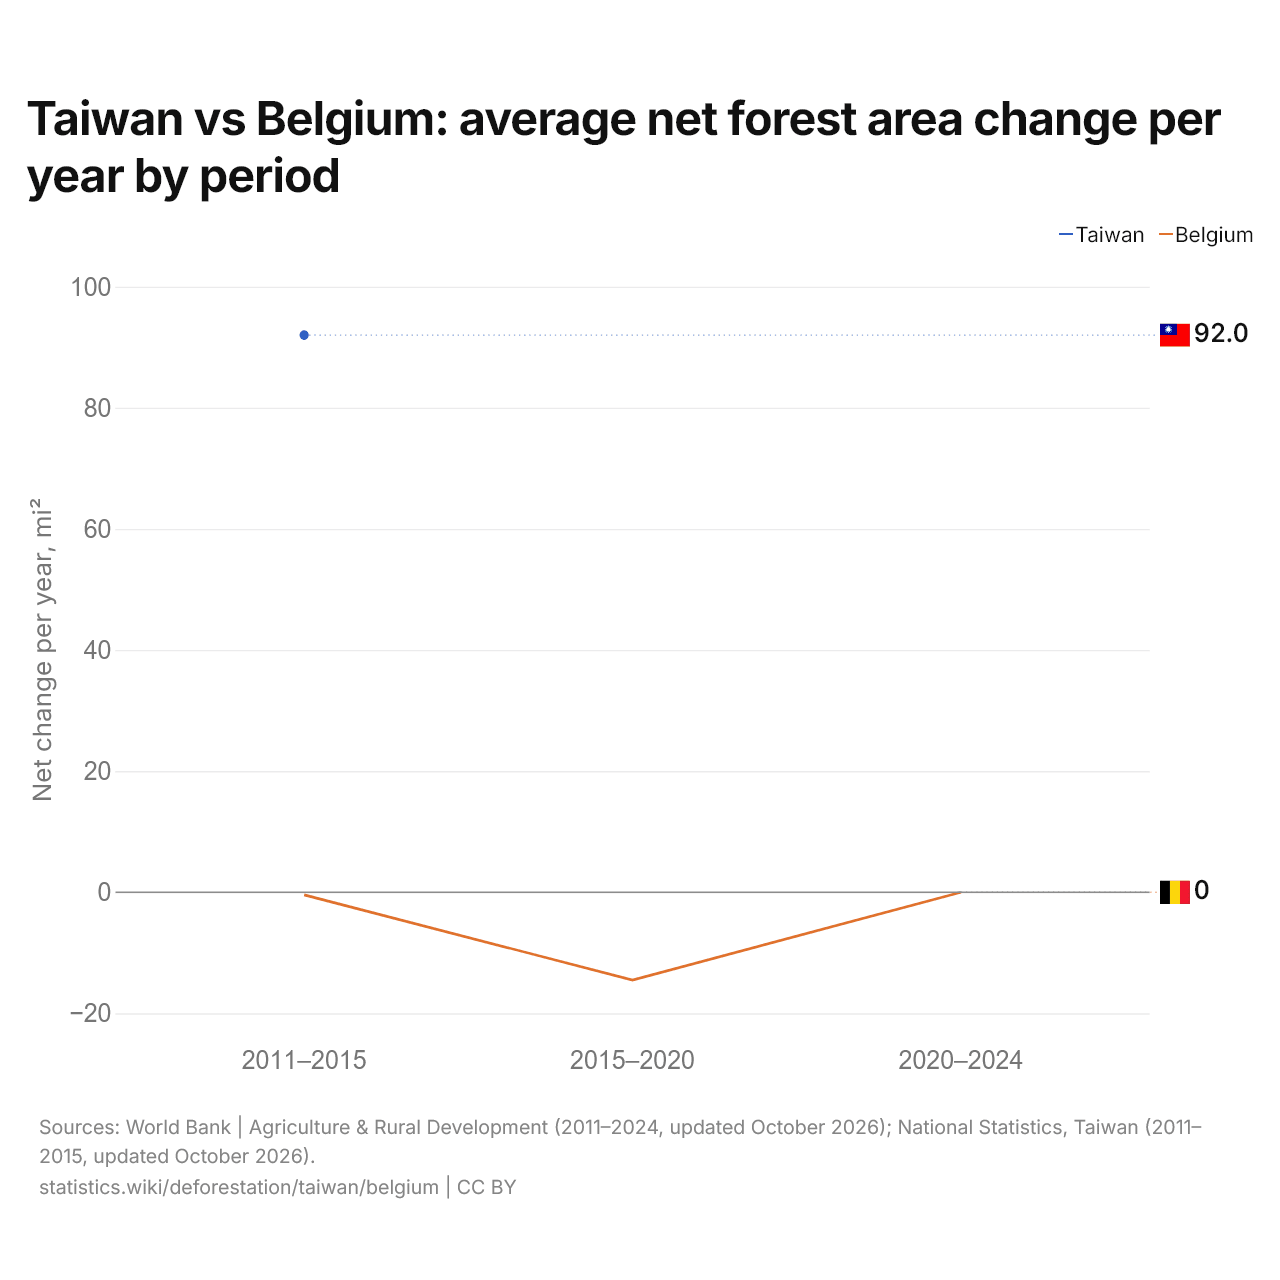
| Period | Net change per year, mi² | |
|---|---|---|
| Taiwan | Belgium | |
| 2011–2015 | 92 | −0.444 |
| 2015–2020 | - | −14.5 |
| 2020–2024 | - | 0 |
The forest area grows by 92.1 mi² (238.4 km²) a year in Taiwan and shrinks by 0.44 mi² (1.15 km²) a year in Belgium.
Taiwan vs Belgium: net forest area change
 Taiwan |
 Belgium |
|
|---|---|---|
| Net change since 1990 | +368 mi² since 2011 | +12.4 mi² since 2000 |
| Net change since 1990, % | +4.5% since 2011 | +0.5% since 2000 |
| Average net change per year, 2011–2015 | +92.1 mi² a year | 0 mi² a year |
| Average net change per year, 2011–2015, % | +1.12% | 0% |
Compare the deforestation of any 2 countries
Sources:
- World Bank | Agriculture & Rural Development (2000–2024, updated October 2026)
- National Statistics, Taiwan (2011–2023, updated October 2026)
Creative Commons Attribution (CC BY): you may copy, share, adapt and reuse this content, also commercially, as long as you credit statistics.wiki and note any changes you made. The sources listed above may have their own license terms.