
Sudan vs Australia: average net forest area change per year by period
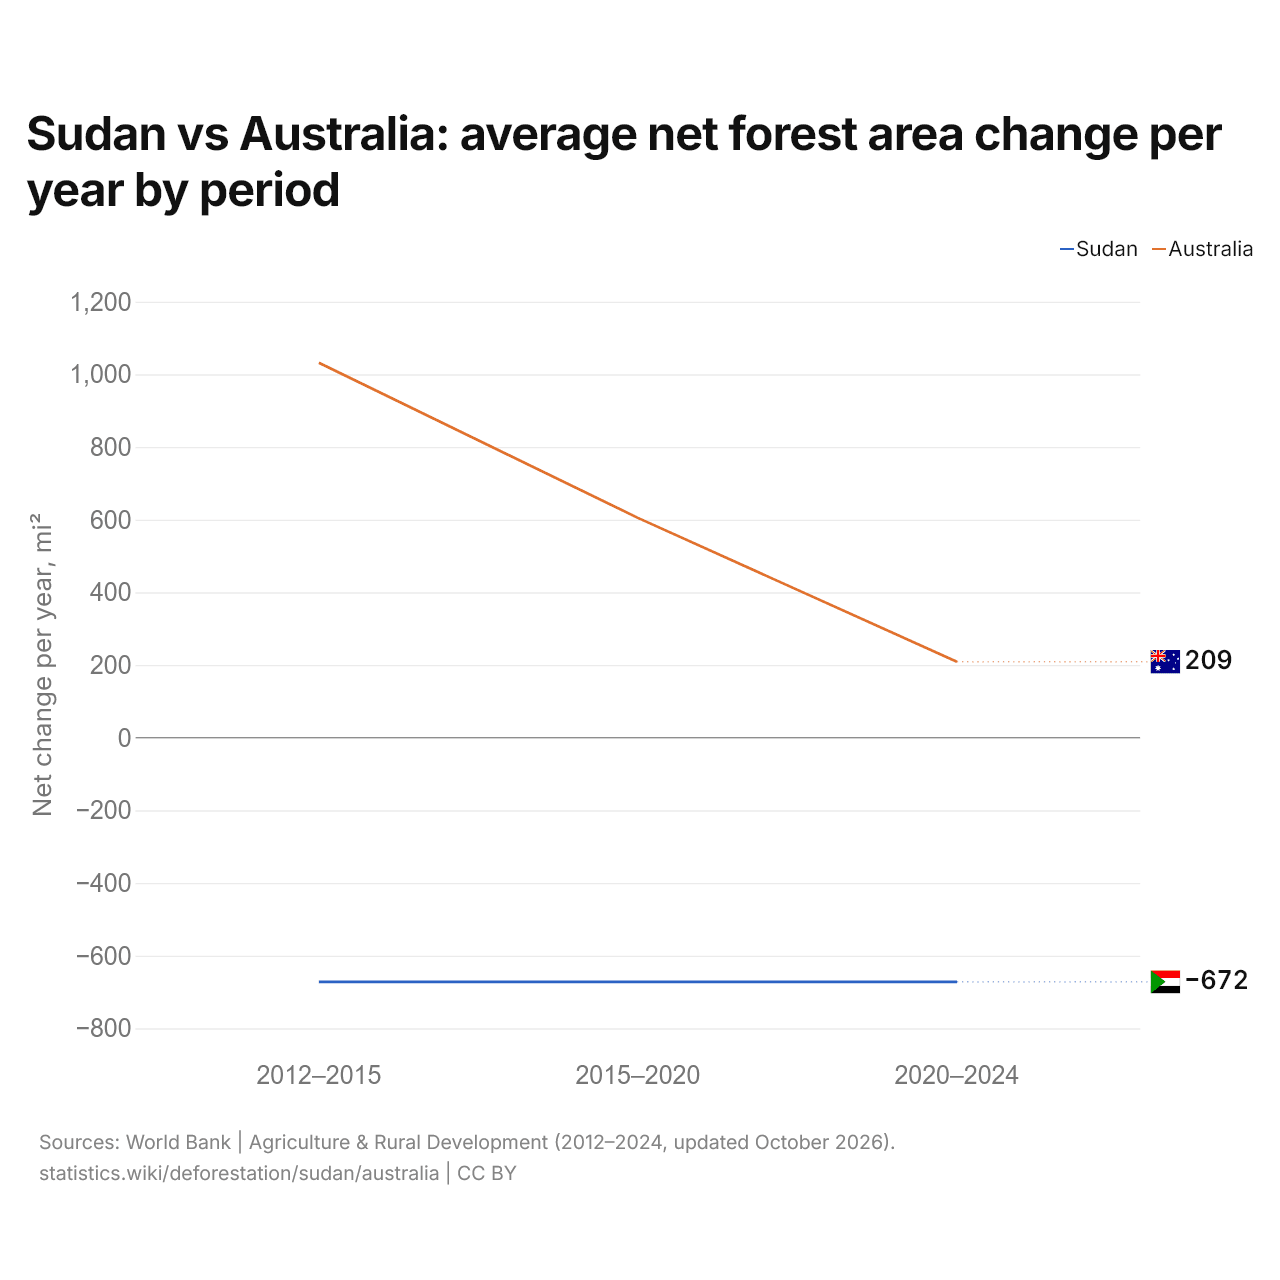
| Period | Net change per year, mi² | |
|---|---|---|
| Sudan | Australia | |
| 2012–2015 | −672 | 1,032 |
| 2015–2020 | −672 | 605 |
| 2020–2024 | −672 | 209 |
The forest area shrinks by 672 mi² (1,741 km²) a year in Sudan and grows by 208.9 mi² (541 km²) a year in Australia. In 2012–2015, it shrank by 672 mi² (1,741 km²) a year in Sudan and grew by 1,032 mi² (2,673 km²) a year in Australia.
Sudan vs Australia: net forest area change
 Sudan |
 Australia |
|
|---|---|---|
| Net change since 1990 | −8,068 mi² since 2012 | −4,120 mi² |
| Net change since 1990, % | −8.6% since 2012 | −0.8% |
| Average net change per year, 2020–2024 | −672 mi² a year | +208.9 mi² a year |
| Average net change per year, 2020–2024, % | −0.77% | +0.04% |
| World rank by net forest loss since 1990 | n/a | #39 of 186 |
| Rank in region | n/a | #1 of 12 (Oceania) |
| Rank in income group | n/a | #1 of 61 (high) |
Australia and nearby countries: net forest area change since 1990, %





Since 1990, Australia's forest area has shrunk by 0.8%, while Sudan's has shrunk by 8.6% since 2012; among the countries near Australia, the Solomon Islands has had the smallest loss, 1.0%, and Indonesia the largest loss, 17.6%.
Compare the deforestation of any 2 countries
Sources:
- World Bank | Agriculture & Rural Development (1990–2024, updated October 2026)
Creative Commons Attribution (CC BY): you may copy, share, adapt and reuse this content, also commercially, as long as you credit statistics.wiki and note any changes you made. The sources listed above may have their own license terms.