
Least corrupt countries: highest CPI scores, 2025
-
 Denmark
-
 Finland
-
 Singapore
-
 New Zealand
-
 Norway
-
 Sweden
-
 Switzerland
-
 Luxembourg
-
 Netherlands
-
 Germany
-
 Iceland
Most corrupt countries: lowest CPI scores, 2025
The 2025 index scores 178 countries, from Denmark (89) to South Sudan and Somalia (9). Of the eleven countries with the highest scores, nine are in Europe; of the eleven with the lowest, six are in Africa.
Corruption perceptions index 2025: all countries ranked
| Rank | Country | CPI score (0–100) | Change since 2012 |
|---|---|---|---|
| 1 | Denmark |
89 | −1 |
| 2 | Finland |
88 | −2 |
| 3 | Singapore |
84 | −3 |
| 4 | New Zealand |
81 | −9 |
| 4 | Norway |
81 | −4 |
| 6 | Sweden |
80 | −8 |
| 6 | Switzerland |
80 | −6 |
| 8 | Luxembourg |
78 | −2 |
| 8 | Netherlands |
78 | −6 |
| 10 | Germany |
77 | −2 |
| 10 | Iceland |
77 | −5 |
| 12 |  Australia |
76 | −9 |
| 12 |  Estonia |
76 | +12 |
| 12 |  Ireland |
76 | +7 |
| 15 |  Canada |
75 | −9 |
| 16 |  Uruguay |
73 | +1 |
| 17 |  Bhutan |
71 | +8 |
| 17 |  Japan |
71 | −3 |
| 19 |  United Kingdom |
70 | −4 |
| 20 |  Austria |
69 | 0 |
| 20 |  Belgium |
69 | −6 |
| 20 |  UAE |
69 | +1 |
| 23 |  Barbados |
68 | −8 |
| 23 |  Seychelles |
68 | +16 |
| 23 |  Taiwan |
68 | +7 |
| 26 |  France |
66 | −5 |
| 27 |  Lithuania |
65 | +11 |
| 28 |  Bahamas |
64 | −7 |
| 28 |  United States |
64 | −9 |
| 30 |  Brunei |
63 | +8 |
| 30 |  Chile |
63 | −9 |
| 30 |  Saint Vincent |
63 | +1 |
| 30 |  South Korea |
63 | +7 |
| 34 |  Cape Verde |
62 | +2 |
| 34 |  Israel |
62 | +2 |
| 36 |  Dominica |
60 | +2 |
| 36 |  Latvia |
60 | +11 |
| 38 |  Czech Republic |
59 | +10 |
| 38 |  Saint Lucia |
59 | −12 |
| 40 |  Botswana |
58 | −7 |
| 40 |  Qatar |
58 | −10 |
| 40 |  Rwanda |
58 | +5 |
| 40 |  Slovenia |
58 | −3 |
| 44 |  Saudi Arabia |
57 | +13 |
| 45 |  Costa Rica |
56 | +2 |
| 45 |  Grenada |
56 | n/a |
| 45 |  Portugal |
56 | −7 |
| 48 |  Cyprus |
55 | −11 |
| 48 |  Spain |
55 | −10 |
| 50 |  Italy |
53 | +11 |
| 50 |  Poland |
53 | −5 |
| 52 |  Malaysia |
52 | +3 |
| 52 |  Oman |
52 | +5 |
| 54 |  Bahrain |
50 | −1 |
| 54 |  Georgia |
50 | −2 |
| 54 |  Greece |
50 | +14 |
| 54 |  Jordan |
50 | +2 |
| 58 |  Malta |
49 | −8 |
| 59 |  Mauritius |
48 | −9 |
| 59 |  Slovakia |
48 | +2 |
| 61 |  Croatia |
47 | +1 |
| 61 |  Vanuatu |
47 | n/a |
| 63 |  Armenia |
46 | +12 |
| 63 |  Kuwait |
46 | +2 |
| 63 |  Montenegro |
46 | +5 |
| 63 |  Namibia |
46 | −2 |
| 63 |  Senegal |
46 | +10 |
| 68 |  Benin |
45 | +9 |
| 68 |  Romania |
45 | +1 |
| 68 |  Sao Tome |
45 | +3 |
| 71 |  East Timor |
44 | +11 |
| 71 |  Jamaica |
44 | +6 |
| 71 |  Solomon Islands |
44 | n/a |
| 74 |  China |
43 | +4 |
| 74 |  Ghana |
43 | −2 |
| 74 |  Ivory Coast |
43 | +14 |
| 77 |  Moldova |
42 | +6 |
| 78 |  South Africa |
41 | −2 |
| 78 |  Trinidad |
41 | +2 |
| 78 |  Vietnam |
41 | +10 |
| 81 |  Bulgaria |
40 | −1 |
| 81 |  Burkina Faso |
40 | +2 |
| 81 |  Cuba |
40 | −8 |
| 81 |  Guyana |
40 | +12 |
| 81 |  Hungary |
40 | −15 |
| 81 |  North Macedonia |
40 | −3 |
| 81 |  Tanzania |
40 | +5 |
| 88 |  Albania |
39 | +6 |
| 88 |  India |
39 | +3 |
| 88 |  Maldives |
39 | n/a |
| 88 |  Morocco |
39 | +2 |
| 88 |  Tunisia |
39 | −2 |
| 93 |  Ethiopia |
38 | +5 |
| 93 |  Kazakhstan |
38 | +10 |
| 93 |  Suriname |
38 | +1 |
| 96 |  Colombia |
37 | +1 |
| 96 |  Dominican Republic |
37 | +5 |
| 96 |  Gambia |
37 | +3 |
| 96 |  Lesotho |
37 | −8 |
| 96 |  Zambia |
37 | 0 |
| 101 |  Argentina |
36 | +1 |
| 101 |  Ukraine |
36 | +10 |
| 103 |  Brazil |
35 | −8 |
| 103 |  Sri Lanka |
35 | −5 |
| 105 |  Algeria |
34 | 0 |
| 105 |  Bosnia |
34 | −8 |
| 105 |  Indonesia |
34 | +2 |
| 105 |  Laos |
34 | +13 |
| 105 |  Malawi |
34 | −3 |
| 105 |  Nepal |
34 | +7 |
| 105 |  Sierra Leone |
34 | +3 |
| 112 |  Ecuador |
33 | +1 |
| 112 |  Panama |
33 | −5 |
| 112 |  Serbia |
33 | −6 |
| 112 |  Thailand |
33 | −4 |
| 116 |  Angola |
32 | +10 |
| 116 |  El Salvador |
32 | −6 |
| 116 |  Philippines |
32 | −2 |
| 116 |  Togo |
32 | +2 |
| 120 |  Belarus |
31 | 0 |
| 120 |  Djibouti |
31 | −5 |
| 120 |  Mongolia |
31 | −5 |
| 120 |  Niger |
31 | −2 |
| 120 |  Turkey |
31 | −18 |
| 120 |  Uzbekistan |
31 | +14 |
| 126 |  Azerbaijan |
30 | +3 |
| 126 |  Egypt |
30 | −2 |
| 126 |  Kenya |
30 | +3 |
| 126 |  Mauritania |
30 | −1 |
| 126 |  Peru |
30 | −8 |
| 131 |  Gabon |
29 | −6 |
| 132 |  Bolivia |
28 | −6 |
| 132 |  Iraq |
28 | +10 |
| 132 |  Liberia |
28 | −13 |
| 132 |  Mali |
28 | −6 |
| 132 |  Pakistan |
28 | +1 |
| 137 |  Mexico |
27 | −7 |
| 138 |  Cameroon |
26 | 0 |
| 138 |  Guatemala |
26 | −7 |
| 138 |  Guinea |
26 | +2 |
| 138 |  Kyrgyzstan |
26 | +2 |
| 138 |  Nigeria |
26 | −1 |
| 138 |  Papua New Guinea |
26 | +1 |
| 144 |  Madagascar |
25 | −7 |
| 144 |  Uganda |
25 | −4 |
| 146 |  Bangladesh |
24 | −2 |
| 146 |  CAR |
24 | −2 |
| 146 |  Paraguay |
24 | −1 |
| 149 |  Congo |
23 | −3 |
| 149 |  Eswatini |
23 | −14 |
| 149 |  Iran |
23 | −5 |
| 149 |  Lebanon |
23 | −7 |
| 153 |  Chad |
22 | +3 |
| 153 |  Honduras |
22 | −6 |
| 153 |  Russia |
22 | −6 |
| 153 |  Zimbabwe |
22 | +2 |
| 157 |  Guinea-Bissau |
21 | −4 |
| 157 |  Mozambique |
21 | −10 |
| 159 |  Cambodia |
20 | −2 |
| 159 |  Comoros |
20 | −8 |
| 159 |  DR Congo |
20 | −1 |
| 162 |  Tajikistan |
19 | −3 |
| 163 |  Burundi |
17 | −2 |
| 163 |  Turkmenistan |
17 | 0 |
| 165 |  Afghanistan |
16 | +8 |
| 165 |  Haiti |
16 | −3 |
| 165 |  Myanmar |
16 | +1 |
| 168 |  Equatorial Guinea |
15 | −5 |
| 168 |  North Korea |
15 | +7 |
| 168 |  Syria |
15 | −11 |
| 171 |  Nicaragua |
14 | −15 |
| 171 |  Sudan |
14 | +1 |
| 173 |  Eritrea |
13 | −12 |
| 173 |  Libya |
13 | −8 |
| 173 |  Yemen |
13 | −10 |
| 176 |  Venezuela |
10 | −9 |
| 177 |  Somalia |
9 | +1 |
| 177 |  South Sudan |
9 | n/a |
In half of the countries, the score is 39 or lower. Since 2012, the scores of 76 of the 173 countries have risen and 91 have fallen.
The Corruption Perceptions Index of Transparency International scores how corrupt each country's public sector is perceived to be, on a scale from 0 (highly corrupt) to 100 (very clean). It combines surveys and assessments by experts and business people from several institutions. The scores are comparable from 2012, when the method changed; countries with the same score share a rank, as Transparency International ranks them. The ranks are among the countries in this list.
Corruption perceptions index by country map, 2006–2025
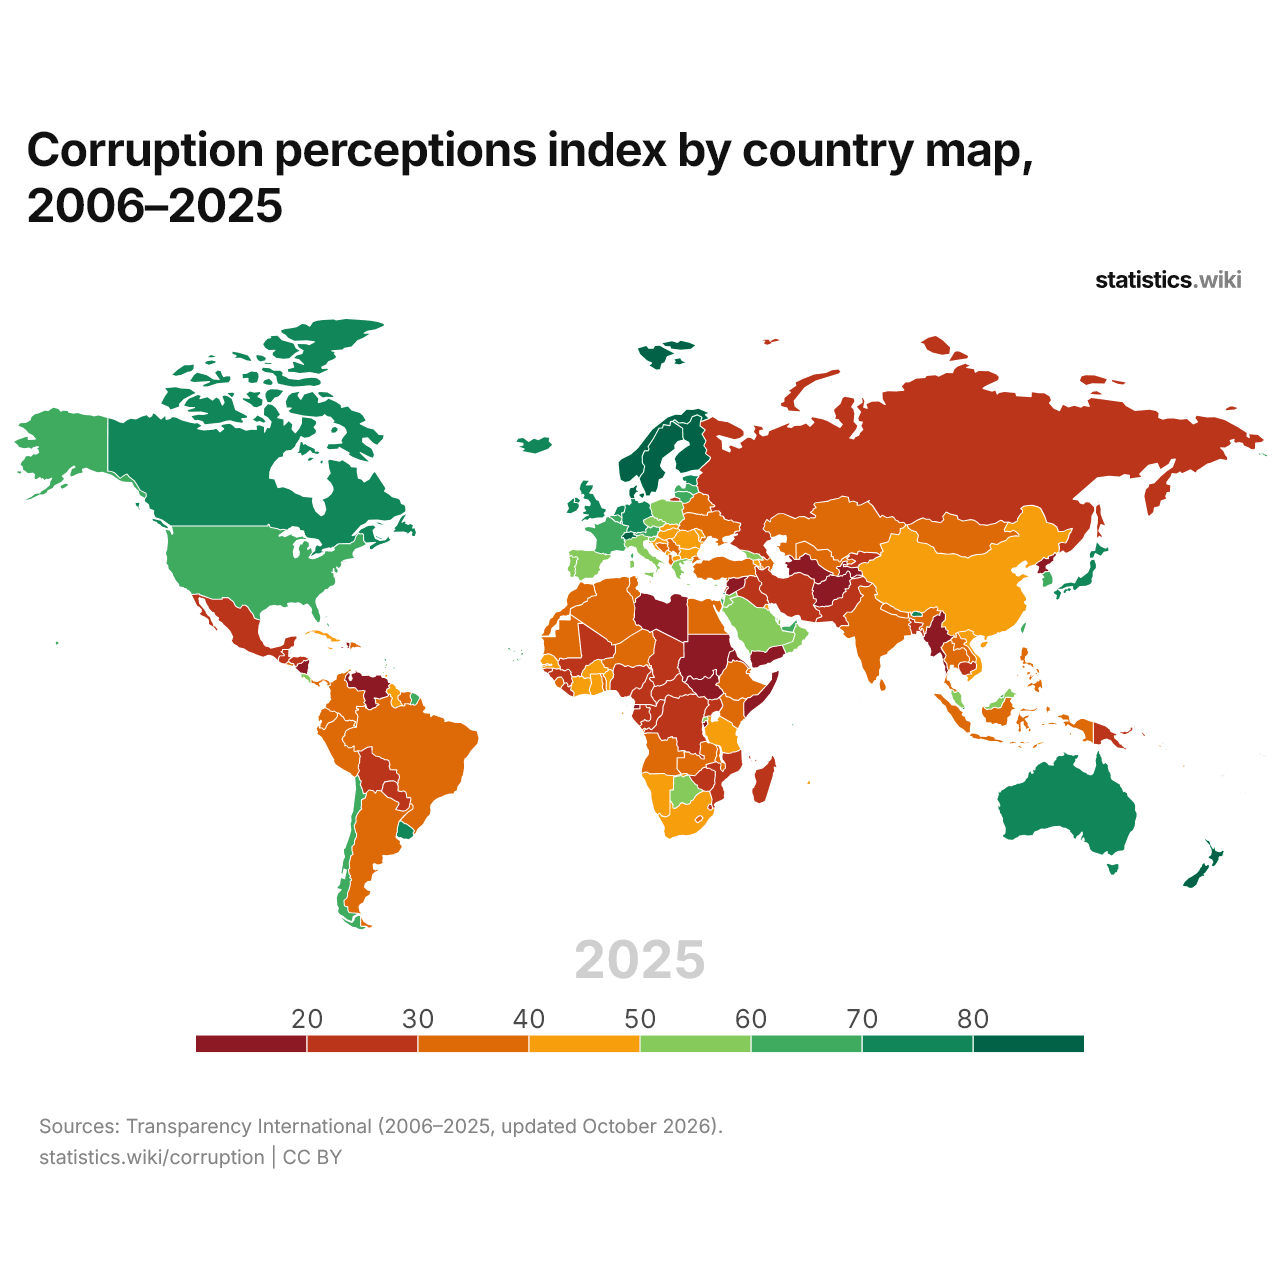
In 2025, 18 countries scored above 70 and 48 below 30; in 2006, the numbers were 21 and 71.
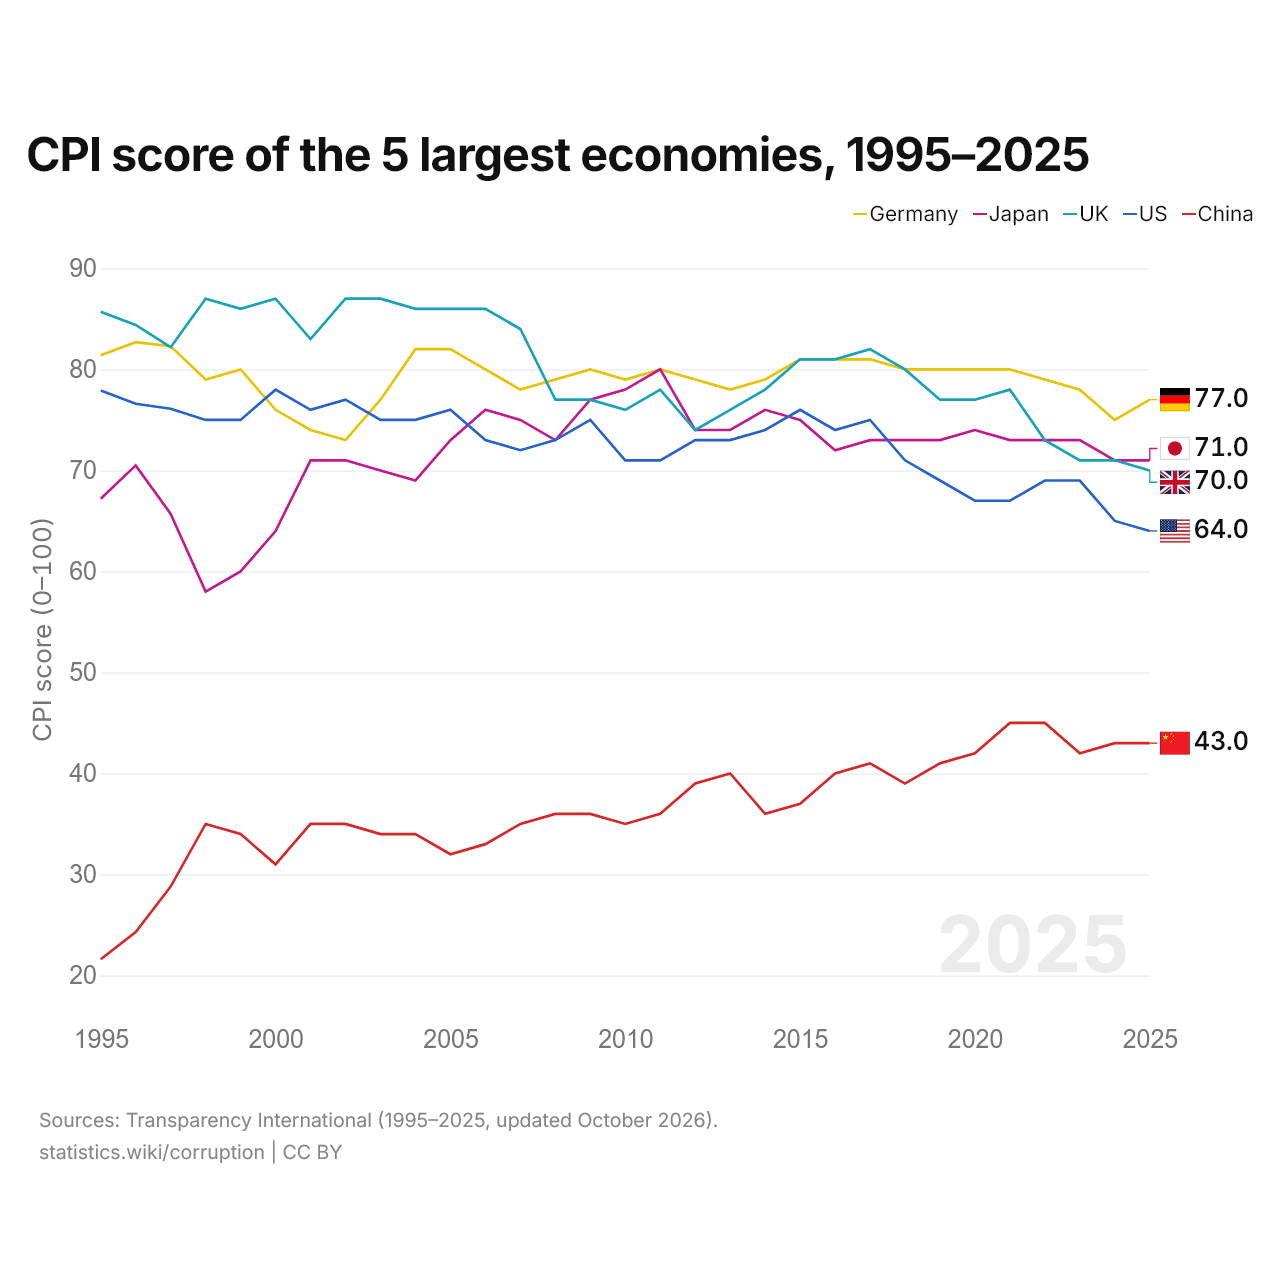
CPI score of the 5 largest economies, 1995–2025
| Year | CPI score (0–100) | ||||
|---|---|---|---|---|---|
| Germany | Japan | United Kingdom | United States | China | |
| 2025 | 77 | 71 | 70 | 64 | 43 |
| 2024 | 75 | 71 | 71 | 65 | 43 |
| 2023 | 78 | 73 | 71 | 69 | 42 |
| 2022 | 79 | 73 | 73 | 69 | 45 |
| 2021 | 80 | 73 | 78 | 67 | 45 |
| 2020 | 80 | 74 | 77 | 67 | 42 |
| 2019 | 80 | 73 | 77 | 69 | 41 |
| 2018 | 80 | 73 | 80 | 71 | 39 |
| 2017 | 81 | 73 | 82 | 75 | 41 |
| 2016 | 81 | 72 | 81 | 74 | 40 |
| 2015 | 81 | 75 | 81 | 76 | 37 |
| 2014 | 79 | 76 | 78 | 74 | 36 |
| 2013 | 78 | 74 | 76 | 73 | 40 |
| 2012 | 79 | 74 | 74 | 73 | 39 |
| 2011 | 80 | 80 | 78 | 71 | 36 |
| 2010 | 79 | 78 | 76 | 71 | 35 |
| 2009 | 80 | 77 | 77 | 75 | 36 |
| 2008 | 79 | 73 | 77 | 73 | 36 |
| 2007 | 78 | 75 | 84 | 72 | 35 |
| 2006 | 80 | 76 | 86 | 73 | 33 |
| 2005 | 82 | 73 | 86 | 76 | 32 |
| 2004 | 82 | 69 | 86 | 75 | 34 |
| 2003 | 77 | 70 | 87 | 75 | 34 |
| 2002 | 73 | 71 | 87 | 77 | 35 |
| 2001 | 74 | 71 | 83 | 76 | 35 |
| 2000 | 76 | 64 | 87 | 78 | 31 |
| 1999 | 80 | 60 | 86 | 75 | 34 |
| 1998 | 79 | 58 | 87 | 75 | 35 |
| 1997 | 82.3 | 65.7 | 82.2 | 76.1 | 28.8 |
| 1996 | 82.7 | 70.5 | 84.4 | 76.6 | 24.3 |
| 1995 | 81.4 | 67.2 | 85.7 | 77.9 | 21.6 |
In 2025, the scores were 77 for Germany, 71 for Japan, 70 for the United Kingdom, 64 for the United States and 43 for China. Germany's score has been the highest of the five since 2018. The most recent change in their order came in 2022, when Japan passed the United Kingdom.
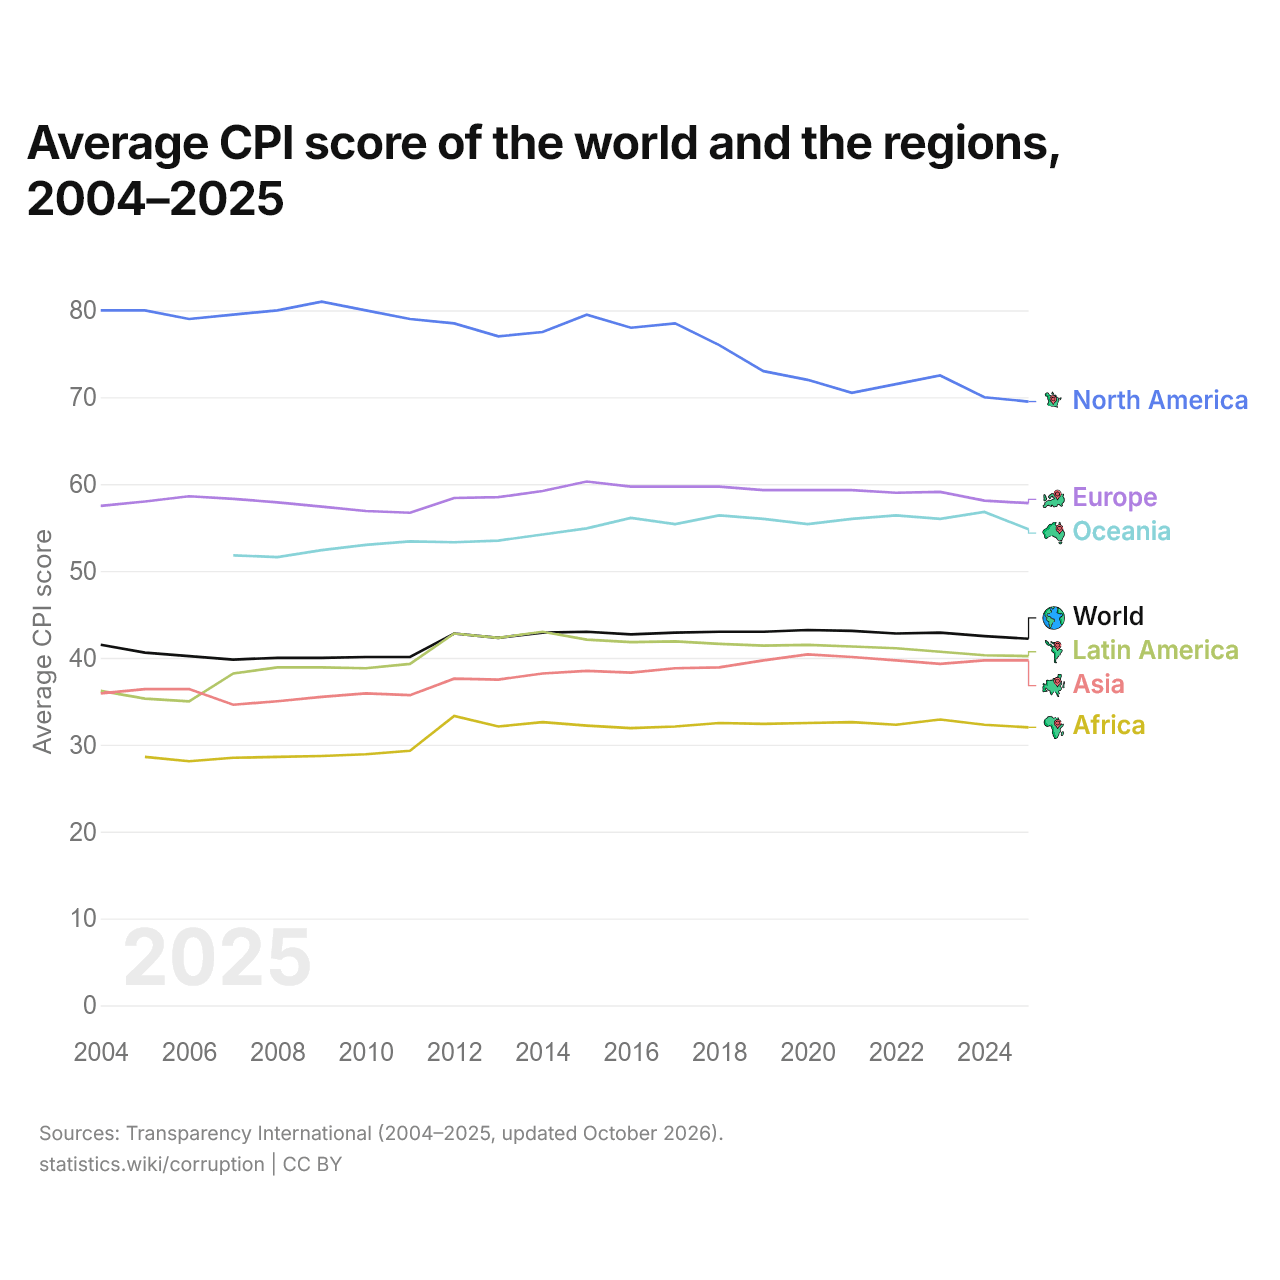
Average CPI score of the world and the regions, 2004–2025
| Year | Average CPI score | ||||||
|---|---|---|---|---|---|---|---|
| World | North America | Europe | Oceania | Latin America | Asia | Africa | |
| 2025 | 42.2 | 69.5 | 57.8 | 54.8 | 40.2 | 39.7 | 32 |
| 2024 | 42.5 | 70 | 58.1 | 56.8 | 40.3 | 39.7 | 32.3 |
| 2023 | 42.9 | 72.5 | 59.1 | 56 | 40.7 | 39.3 | 32.9 |
| 2022 | 42.8 | 71.5 | 59 | 56.4 | 41.1 | 39.7 | 32.3 |
| 2021 | 43.1 | 70.5 | 59.3 | 56 | 41.3 | 40.1 | 32.6 |
| 2020 | 43.2 | 72 | 59.3 | 55.4 | 41.5 | 40.4 | 32.5 |
| 2019 | 43 | 73 | 59.3 | 56 | 41.4 | 39.7 | 32.4 |
| 2018 | 43 | 76 | 59.7 | 56.4 | 41.6 | 38.9 | 32.5 |
| 2017 | 42.9 | 78.5 | 59.7 | 55.4 | 41.9 | 38.8 | 32.1 |
| 2016 | 42.7 | 78 | 59.7 | 56.1 | 41.8 | 38.3 | 31.9 |
| 2015 | 43 | 79.5 | 60.3 | 54.9 | 42.1 | 38.5 | 32.2 |
| 2014 | 42.9 | 77.5 | 59.2 | 54.2 | 43 | 38.2 | 32.6 |
| 2013 | 42.3 | 77 | 58.5 | 53.5 | 42.3 | 37.5 | 32.1 |
| 2012 | 42.8 | 78.5 | 58.4 | 53.3 | 42.8 | 37.6 | 33.3 |
| 2011 | 40.1 | 79 | 56.7 | 53.4 | 39.3 | 35.7 | 29.3 |
| 2010 | 40.1 | 80 | 56.9 | 53 | 38.8 | 35.9 | 28.9 |
| 2009 | 40 | 81 | 57.4 | 52.4 | 38.9 | 35.5 | 28.7 |
| 2008 | 40 | 80 | 57.9 | 51.6 | 38.9 | 35 | 28.6 |
| 2007 | 39.8 | 79.5 | 58.3 | 51.8 | 38.2 | 34.6 | 28.5 |
| 2006 | 40.2 | 79 | 58.6 | - | 35 | 36.4 | 28.1 |
| 2005 | 40.6 | 80 | 58 | - | 35.3 | 36.4 | 28.6 |
| 2004 | 41.5 | 80 | 57.5 | - | 36.2 | 35.9 | - |
In 2025, the average score was highest in North America, 69.5, and lowest in Africa, 32. The world average was 42.2, up from 39.8 in 2007.
Compare the corruption index of any 2 countries
Sources:
- Transparency International (1995–2025, updated October 2026)
Creative Commons Attribution (CC BY): you may copy, share, adapt and reuse this content, also commercially, as long as you credit statistics.wiki and note any changes you made. The sources listed above may have their own license terms.