
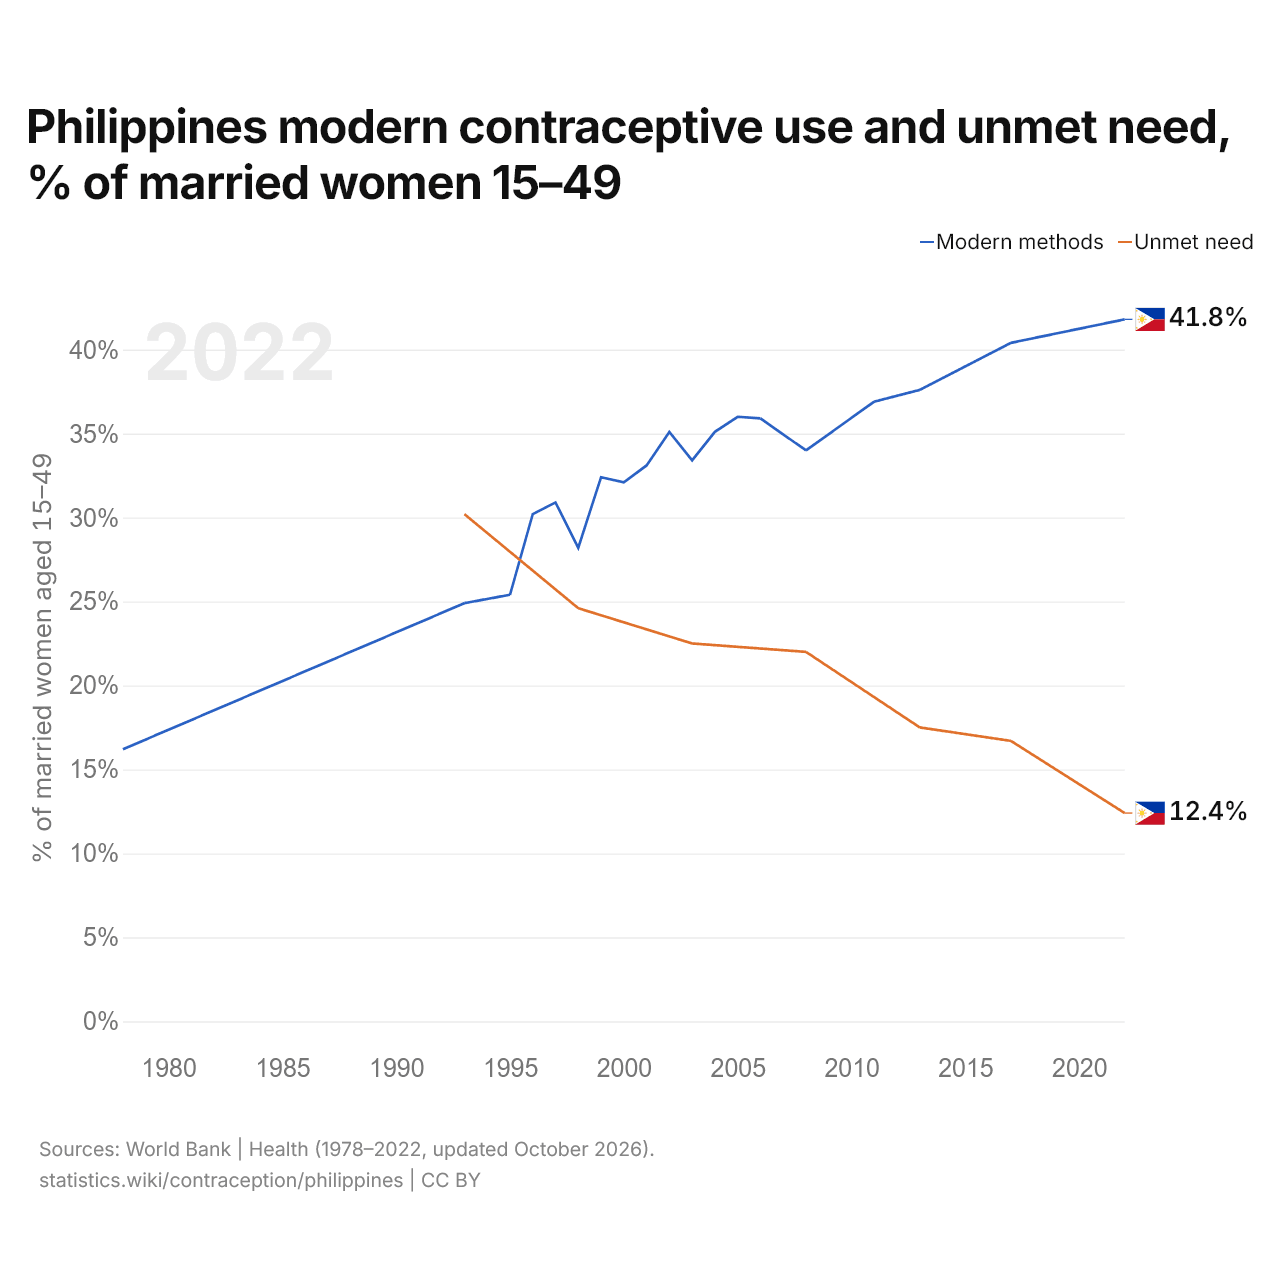
Philippines modern contraceptive use and unmet need, % of married women 15–49
| Year | % of married women aged 15–49 | |
|---|---|---|
| Modern methods | Unmet need | |
| 2022 | 41.8% | 12.4% |
| 2017 | 40.4% | 16.7% |
| 2013 | 37.6% | 17.5% |
| 2011 | 36.9% | 19.3% |
| 2008 | 34% | 22% |
| 2006 | 35.9% | - |
| 2005 | 36% | - |
| 2004 | 35.1% | - |
| 2003 | 33.4% | 22.5% |
| 2002 | 35.1% | - |
| 2001 | 33.1% | - |
| 2000 | 32.1% | - |
| 1999 | 32.4% | - |
| 1998 | 28.2% | 24.6% |
| 1997 | 30.9% | - |
| 1996 | 30.2% | - |
| 1995 | 25.4% | - |
| 1993 | 24.9% | 30.2% |
| 1978 | 16.2% | - |
In the Philippines, 41.8% of married women aged 15–49 use a modern method of contraception, up from 16.2% in 1978. The unmet need in the Philippines, the share of them who want to stop or delay having children but use no method, is 12.4%.
The Philippines' share of married women using a modern method is the 21st highest of the 34 countries of Asia in the ranking of the latest figures, where they range from Maldives' 14.9% (2017) to China's 80.5% (2017).
Philippines in the contraceptive prevalence ranking: 63/123
| Rank | Country | Modern methods | Survey year | Unmet need | |
|---|---|---|---|---|---|
| 60 |
 Palestine |
42.8% | 2020 | 12.9% | |
| 61 |
 Madagascar |
42.7% | 2021 | 14.6% | vs Madagascar |
| 61 |
 Nepal |
42.7% | 2022 | 20.8% | vs Nepal |
| 63 |
 Philippines |
41.8% | 2022 | 12.4% | |
| 64 |
 Suriname |
38.7% | 2018 | 28.4% | |
| 65 |
 Jordan |
38.4% | 2023 | 10.8% | |
| 66 |
 Uganda |
38.0% | 2022 | 21.8% |
Compare contraceptive use in the Philippines with other countries
Sources:
- World Bank | Health (1978–2023, updated October 2026)
Creative Commons Attribution (CC BY): you may copy, share, adapt and reuse this content, also commercially, as long as you credit statistics.wiki and note any changes you made. The sources listed above may have their own license terms.