
Netherlands vs Japan: chance of a newborn living to 100, 90, 80 and 65, UN life tables, 2026 (projected)
 Netherlands |
 Japan |
|
|---|---|---|
| To 100 | 1.6% | 5.5% |
| World rank | 57/196 | 4/196 |
| To 90 | 29.6% | 41.7% |
| To 80 | 68.9% | 75.0% |
| To 65 | 91.4% | 92.7% |
|
Netherlands
|
Japan
|
|
|---|---|---|
| To 100 | 0.92% | 2.2% |
| World rank | 51/196 | 10/196 |
| To 90 | 23.4% | 29.4% |
| To 80 | 64.1% | 66.7% |
| To 65 | 90.2% | 90.4% |
|
Netherlands
|
Japan
|
|
|---|---|---|
| To 100 | 2.1% | 8.5% |
| World rank | 62/196 | 2/196 |
| To 90 | 35.5% | 53.9% |
| To 80 | 73.7% | 83.5% |
| To 65 | 92.6% | 95.1% |
In 2026, 1.6% of newborns would live to 100 in the Netherlands and 5.5% in Japan: 3.5 times as many in Japan.
For boys, the chance of living to 100 is 0.92% in the Netherlands and 2.2% in Japan; for girls, it is 2.1% and 8.5%.
Netherlands vs Japan: chance of a newborn reaching each age, UN life tables, 2026 (projected)
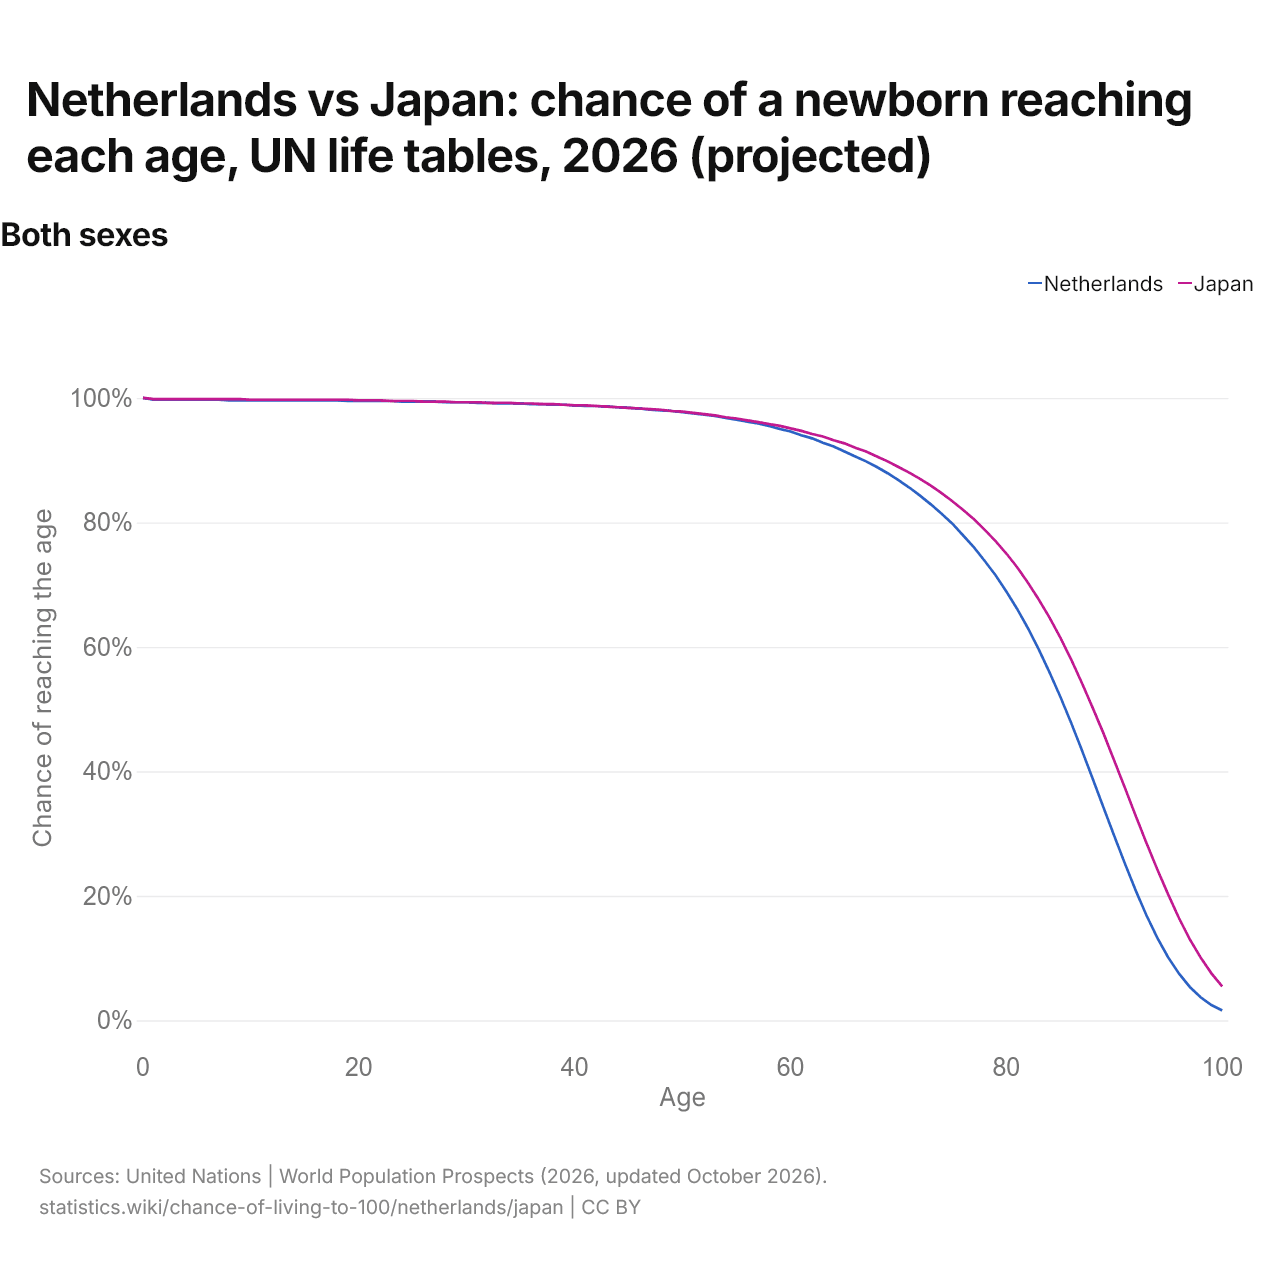
| Age | Chance of reaching the age | |
|---|---|---|
| Netherlands | Japan | |
| 0 | 100% | 100% |
| 1 | 99.7% | 99.8% |
| 2 | 99.7% | 99.8% |
| 3 | 99.7% | 99.8% |
| 4 | 99.7% | 99.8% |
| 5 | 99.7% | 99.8% |
| 6 | 99.7% | 99.8% |
| 7 | 99.7% | 99.8% |
| 8 | 99.6% | 99.8% |
| 9 | 99.6% | 99.8% |
| 10 | 99.6% | 99.7% |
| 11 | 99.6% | 99.7% |
| 12 | 99.6% | 99.7% |
| 13 | 99.6% | 99.7% |
| 14 | 99.6% | 99.7% |
| 15 | 99.6% | 99.7% |
| 16 | 99.6% | 99.7% |
| 17 | 99.6% | 99.7% |
| 18 | 99.6% | 99.7% |
| 19 | 99.5% | 99.7% |
| 20 | 99.5% | 99.6% |
| 21 | 99.5% | 99.6% |
| 22 | 99.5% | 99.6% |
| 23 | 99.5% | 99.5% |
| 24 | 99.4% | 99.5% |
| 25 | 99.4% | 99.5% |
| 26 | 99.4% | 99.4% |
| 27 | 99.4% | 99.4% |
| 28 | 99.3% | 99.4% |
| 29 | 99.3% | 99.3% |
| 30 | 99.3% | 99.3% |
| 31 | 99.2% | 99.3% |
| 32 | 99.2% | 99.2% |
| 33 | 99.1% | 99.2% |
| 34 | 99.1% | 99.2% |
| 35 | 99.1% | 99.1% |
| 36 | 99% | 99.1% |
| 37 | 99% | 99% |
| 38 | 98.9% | 99% |
| 39 | 98.9% | 98.9% |
| 40 | 98.8% | 98.8% |
| 41 | 98.7% | 98.8% |
| 42 | 98.7% | 98.7% |
| 43 | 98.6% | 98.6% |
| 44 | 98.5% | 98.5% |
| 45 | 98.4% | 98.4% |
| 46 | 98.3% | 98.3% |
| 47 | 98.1% | 98.2% |
| 48 | 98% | 98.1% |
| 49 | 97.9% | 97.9% |
| 50 | 97.7% | 97.8% |
| 51 | 97.5% | 97.6% |
| 52 | 97.3% | 97.4% |
| 53 | 97.1% | 97.2% |
| 54 | 96.8% | 96.9% |
| 55 | 96.5% | 96.7% |
| 56 | 96.2% | 96.4% |
| 57 | 95.9% | 96.1% |
| 58 | 95.5% | 95.8% |
| 59 | 95% | 95.5% |
| 60 | 94.6% | 95.1% |
| 61 | 94% | 94.7% |
| 62 | 93.5% | 94.2% |
| 63 | 92.8% | 93.8% |
| 64 | 92.2% | 93.2% |
| 65 | 91.4% | 92.7% |
| 66 | 90.6% | 92% |
| 67 | 89.8% | 91.4% |
| 68 | 88.9% | 90.6% |
| 69 | 87.9% | 89.8% |
| 70 | 86.8% | 88.9% |
| 71 | 85.6% | 88% |
| 72 | 84.3% | 87% |
| 73 | 82.9% | 85.9% |
| 74 | 81.4% | 84.7% |
| 75 | 79.8% | 83.4% |
| 76 | 77.9% | 82% |
| 77 | 76% | 80.5% |
| 78 | 73.8% | 78.8% |
| 79 | 71.5% | 77% |
| 80 | 68.9% | 75% |
| 81 | 66.1% | 72.8% |
| 82 | 63% | 70.3% |
| 83 | 59.6% | 67.6% |
| 84 | 55.9% | 64.7% |
| 85 | 52% | 61.5% |
| 86 | 47.8% | 58% |
| 87 | 43.4% | 54.2% |
| 88 | 38.8% | 50.2% |
| 89 | 34.2% | 46.1% |
| 90 | 29.6% | 41.7% |
| 91 | 25.1% | 37.3% |
| 92 | 20.8% | 32.8% |
| 93 | 16.8% | 28.4% |
| 94 | 13.2% | 24.2% |
| 95 | 10.1% | 20.2% |
| 96 | 7.49% | 16.4% |
| 97 | 5.36% | 13% |
| 98 | 3.7% | 10.1% |
| 99 | 2.46% | 7.55% |
| 100 | 1.57% | 5.47% |
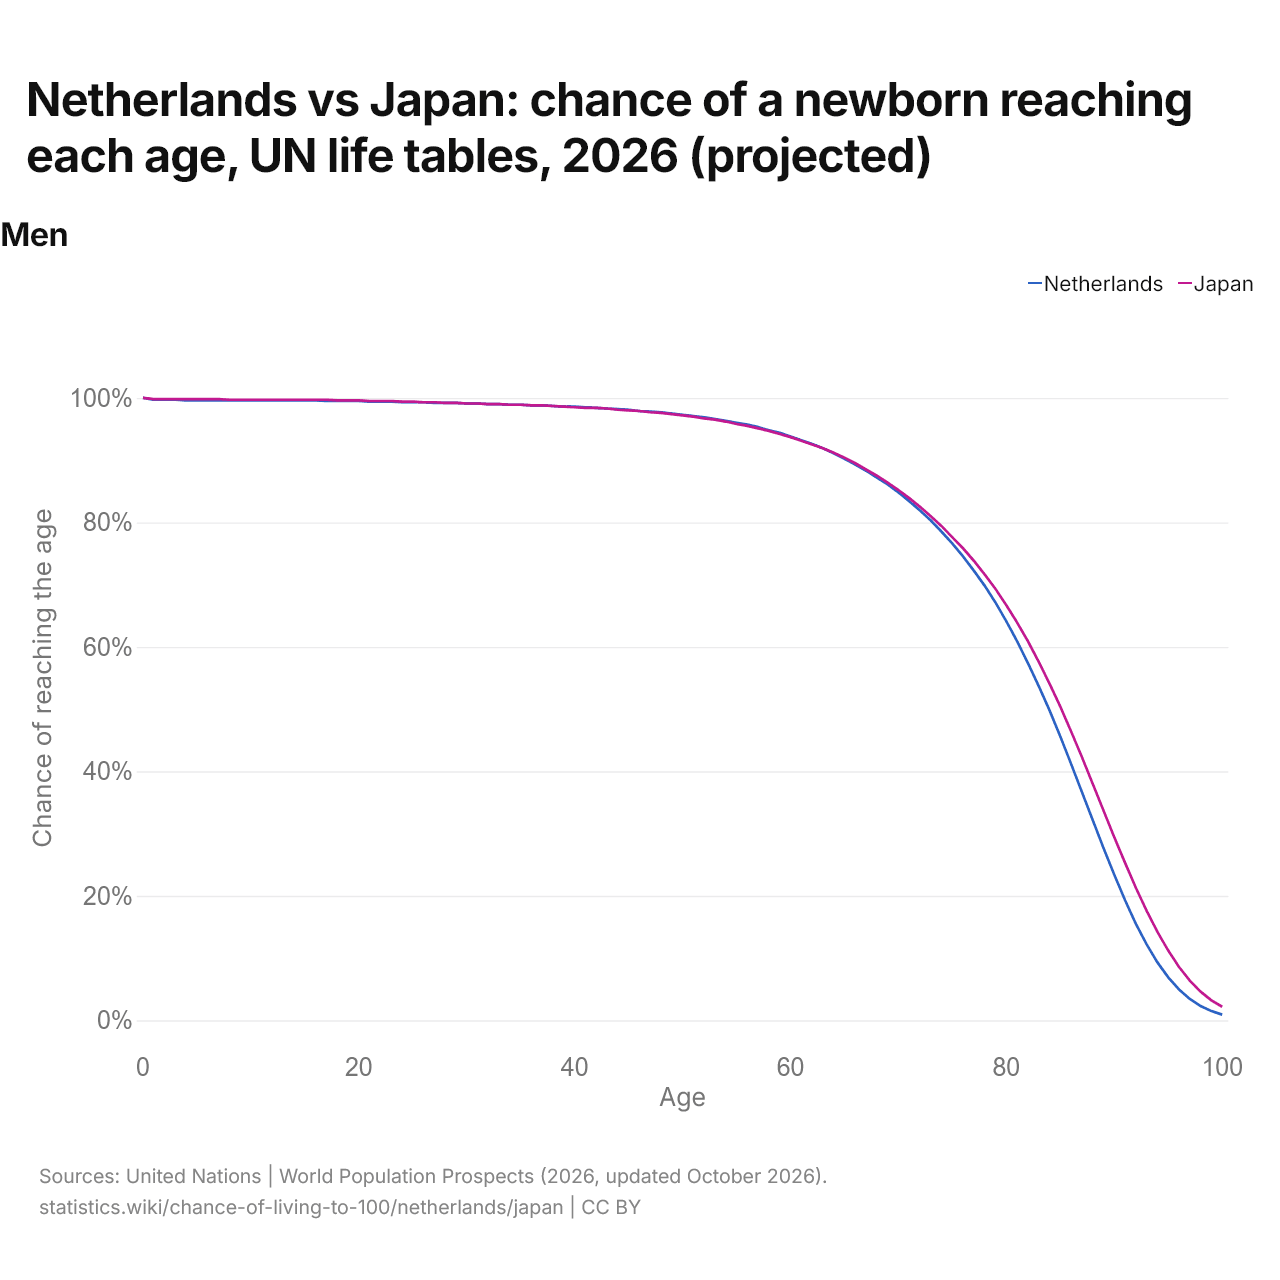
| Age | Chance of reaching the age | |
|---|---|---|
| Netherlands | Japan | |
| 0 | 100% | 100% |
| 1 | 99.7% | 99.8% |
| 2 | 99.7% | 99.8% |
| 3 | 99.7% | 99.8% |
| 4 | 99.6% | 99.8% |
| 5 | 99.6% | 99.8% |
| 6 | 99.6% | 99.8% |
| 7 | 99.6% | 99.8% |
| 8 | 99.6% | 99.7% |
| 9 | 99.6% | 99.7% |
| 10 | 99.6% | 99.7% |
| 11 | 99.6% | 99.7% |
| 12 | 99.6% | 99.7% |
| 13 | 99.6% | 99.7% |
| 14 | 99.6% | 99.7% |
| 15 | 99.6% | 99.7% |
| 16 | 99.6% | 99.7% |
| 17 | 99.5% | 99.7% |
| 18 | 99.5% | 99.6% |
| 19 | 99.5% | 99.6% |
| 20 | 99.5% | 99.6% |
| 21 | 99.4% | 99.5% |
| 22 | 99.4% | 99.5% |
| 23 | 99.4% | 99.5% |
| 24 | 99.3% | 99.4% |
| 25 | 99.3% | 99.4% |
| 26 | 99.3% | 99.3% |
| 27 | 99.2% | 99.3% |
| 28 | 99.2% | 99.2% |
| 29 | 99.2% | 99.2% |
| 30 | 99.1% | 99.1% |
| 31 | 99.1% | 99.1% |
| 32 | 99% | 99% |
| 33 | 99% | 99% |
| 34 | 98.9% | 98.9% |
| 35 | 98.9% | 98.9% |
| 36 | 98.8% | 98.8% |
| 37 | 98.8% | 98.8% |
| 38 | 98.7% | 98.7% |
| 39 | 98.6% | 98.6% |
| 40 | 98.6% | 98.5% |
| 41 | 98.5% | 98.4% |
| 42 | 98.4% | 98.4% |
| 43 | 98.3% | 98.3% |
| 44 | 98.2% | 98.1% |
| 45 | 98.1% | 98% |
| 46 | 97.9% | 97.9% |
| 47 | 97.8% | 97.7% |
| 48 | 97.7% | 97.6% |
| 49 | 97.5% | 97.4% |
| 50 | 97.3% | 97.2% |
| 51 | 97.1% | 97% |
| 52 | 96.9% | 96.7% |
| 53 | 96.6% | 96.5% |
| 54 | 96.3% | 96.2% |
| 55 | 96% | 95.8% |
| 56 | 95.7% | 95.5% |
| 57 | 95.3% | 95.1% |
| 58 | 94.8% | 94.7% |
| 59 | 94.4% | 94.2% |
| 60 | 93.8% | 93.7% |
| 61 | 93.2% | 93.1% |
| 62 | 92.6% | 92.5% |
| 63 | 91.9% | 91.9% |
| 64 | 91.1% | 91.2% |
| 65 | 90.2% | 90.4% |
| 66 | 89.3% | 89.5% |
| 67 | 88.3% | 88.5% |
| 68 | 87.2% | 87.5% |
| 69 | 86.1% | 86.4% |
| 70 | 84.8% | 85.2% |
| 71 | 83.4% | 83.9% |
| 72 | 81.9% | 82.5% |
| 73 | 80.3% | 81% |
| 74 | 78.5% | 79.4% |
| 75 | 76.6% | 77.6% |
| 76 | 74.5% | 75.8% |
| 77 | 72.2% | 73.8% |
| 78 | 69.8% | 71.6% |
| 79 | 67.1% | 69.3% |
| 80 | 64.1% | 66.7% |
| 81 | 60.9% | 63.9% |
| 82 | 57.4% | 60.9% |
| 83 | 53.7% | 57.6% |
| 84 | 49.8% | 54.1% |
| 85 | 45.6% | 50.4% |
| 86 | 41.2% | 46.4% |
| 87 | 36.7% | 42.3% |
| 88 | 32.2% | 38% |
| 89 | 27.7% | 33.7% |
| 90 | 23.4% | 29.4% |
| 91 | 19.3% | 25.3% |
| 92 | 15.5% | 21.3% |
| 93 | 12.2% | 17.6% |
| 94 | 9.31% | 14.2% |
| 95 | 6.9% | 11.2% |
| 96 | 4.95% | 8.56% |
| 97 | 3.43% | 6.38% |
| 98 | 2.3% | 4.61% |
| 99 | 1.48% | 3.22% |
| 100 | 0.918% | 2.18% |
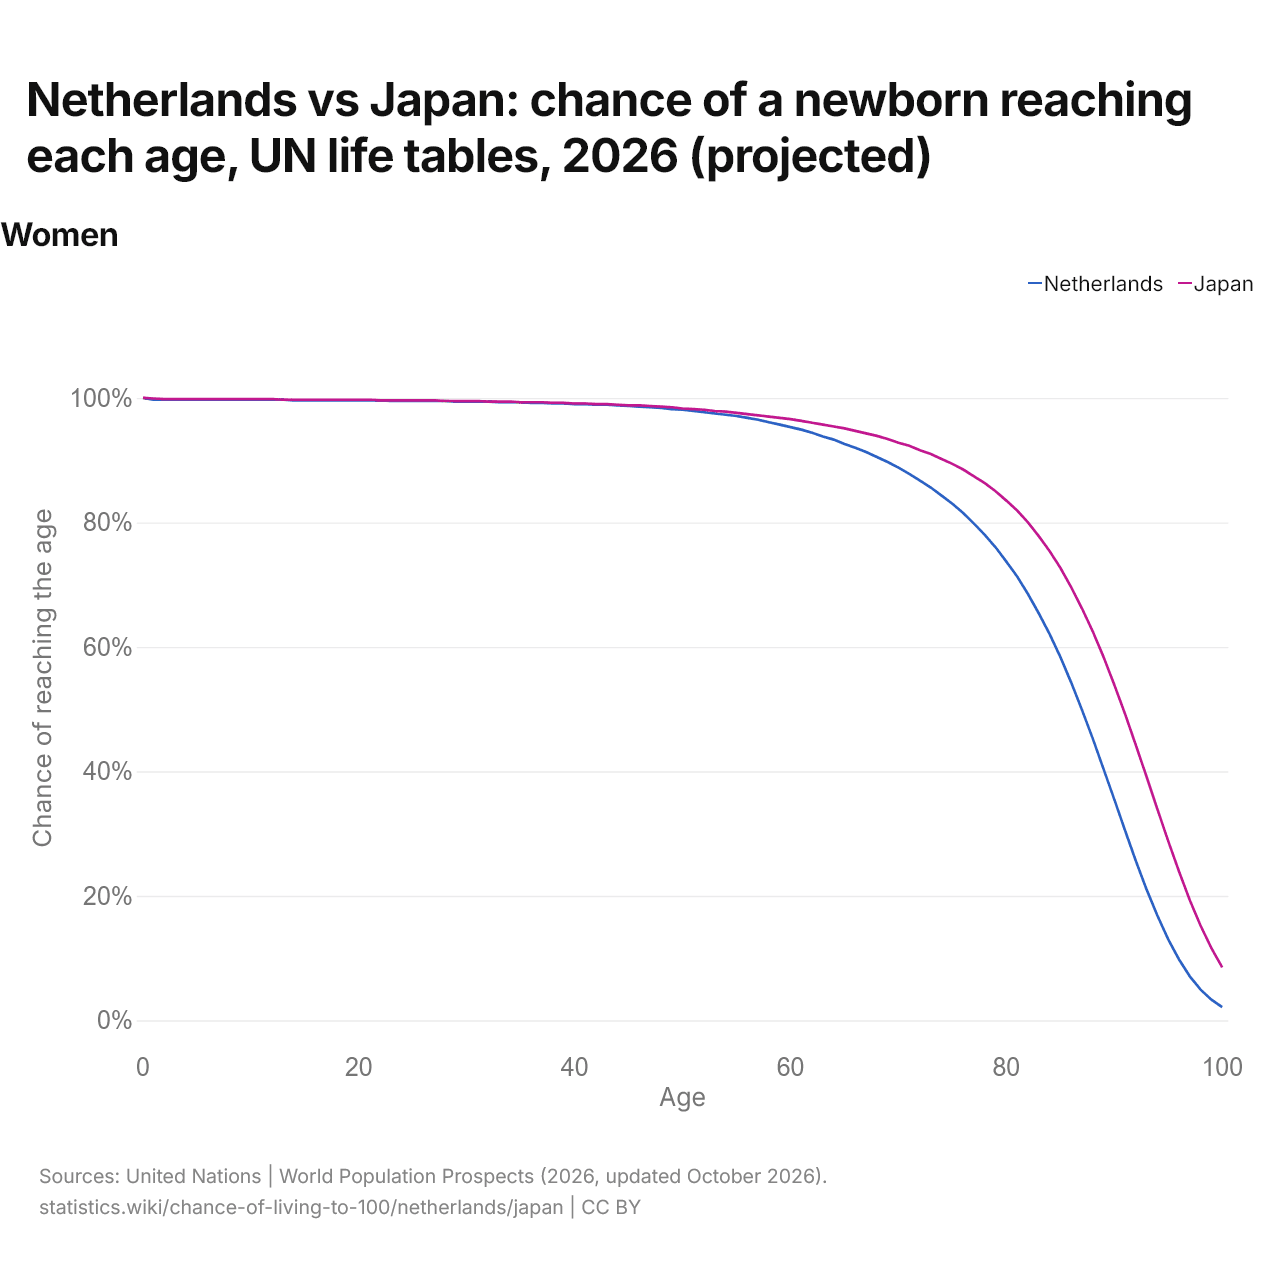
| Age | Chance of reaching the age | |
|---|---|---|
| Netherlands | Japan | |
| 0 | 100% | 100% |
| 1 | 99.7% | 99.9% |
| 2 | 99.7% | 99.8% |
| 3 | 99.7% | 99.8% |
| 4 | 99.7% | 99.8% |
| 5 | 99.7% | 99.8% |
| 6 | 99.7% | 99.8% |
| 7 | 99.7% | 99.8% |
| 8 | 99.7% | 99.8% |
| 9 | 99.7% | 99.8% |
| 10 | 99.7% | 99.8% |
| 11 | 99.7% | 99.8% |
| 12 | 99.7% | 99.8% |
| 13 | 99.7% | 99.7% |
| 14 | 99.6% | 99.7% |
| 15 | 99.6% | 99.7% |
| 16 | 99.6% | 99.7% |
| 17 | 99.6% | 99.7% |
| 18 | 99.6% | 99.7% |
| 19 | 99.6% | 99.7% |
| 20 | 99.6% | 99.7% |
| 21 | 99.6% | 99.7% |
| 22 | 99.6% | 99.6% |
| 23 | 99.5% | 99.6% |
| 24 | 99.5% | 99.6% |
| 25 | 99.5% | 99.6% |
| 26 | 99.5% | 99.6% |
| 27 | 99.5% | 99.6% |
| 28 | 99.5% | 99.5% |
| 29 | 99.4% | 99.5% |
| 30 | 99.4% | 99.5% |
| 31 | 99.4% | 99.5% |
| 32 | 99.4% | 99.4% |
| 33 | 99.3% | 99.4% |
| 34 | 99.3% | 99.4% |
| 35 | 99.3% | 99.3% |
| 36 | 99.2% | 99.3% |
| 37 | 99.2% | 99.3% |
| 38 | 99.1% | 99.2% |
| 39 | 99.1% | 99.2% |
| 40 | 99% | 99.1% |
| 41 | 99% | 99.1% |
| 42 | 98.9% | 99% |
| 43 | 98.9% | 99% |
| 44 | 98.8% | 98.9% |
| 45 | 98.7% | 98.8% |
| 46 | 98.6% | 98.8% |
| 47 | 98.5% | 98.7% |
| 48 | 98.4% | 98.6% |
| 49 | 98.2% | 98.5% |
| 50 | 98.1% | 98.3% |
| 51 | 97.9% | 98.2% |
| 52 | 97.7% | 98.1% |
| 53 | 97.5% | 97.9% |
| 54 | 97.3% | 97.8% |
| 55 | 97.1% | 97.6% |
| 56 | 96.8% | 97.4% |
| 57 | 96.5% | 97.2% |
| 58 | 96.1% | 97% |
| 59 | 95.7% | 96.8% |
| 60 | 95.3% | 96.6% |
| 61 | 94.9% | 96.3% |
| 62 | 94.4% | 96% |
| 63 | 93.8% | 95.7% |
| 64 | 93.3% | 95.4% |
| 65 | 92.6% | 95.1% |
| 66 | 92% | 94.7% |
| 67 | 91.3% | 94.3% |
| 68 | 90.5% | 93.9% |
| 69 | 89.7% | 93.4% |
| 70 | 88.8% | 92.8% |
| 71 | 87.8% | 92.3% |
| 72 | 86.7% | 91.6% |
| 73 | 85.6% | 91% |
| 74 | 84.3% | 90.2% |
| 75 | 83% | 89.4% |
| 76 | 81.5% | 88.5% |
| 77 | 79.8% | 87.4% |
| 78 | 78% | 86.3% |
| 79 | 76% | 85% |
| 80 | 73.7% | 83.5% |
| 81 | 71.3% | 81.9% |
| 82 | 68.5% | 80% |
| 83 | 65.4% | 77.8% |
| 84 | 62.1% | 75.4% |
| 85 | 58.4% | 72.7% |
| 86 | 54.3% | 69.6% |
| 87 | 49.9% | 66.2% |
| 88 | 45.3% | 62.5% |
| 89 | 40.4% | 58.4% |
| 90 | 35.5% | 53.9% |
| 91 | 30.5% | 49.2% |
| 92 | 25.6% | 44.2% |
| 93 | 21% | 39.1% |
| 94 | 16.8% | 33.9% |
| 95 | 13% | 28.8% |
| 96 | 9.77% | 23.9% |
| 97 | 7.07% | 19.3% |
| 98 | 4.93% | 15.2% |
| 99 | 3.31% | 11.6% |
| 100 | 2.13% | 8.52% |
Half of all newborns would live to 85 or older in the Netherlands and to 88 or older in Japan.
Compare the chance of living to 100 in any 2 countries
Sources:
- United Nations | World Population Prospects (2026, updated October 2026)
Creative Commons Attribution (CC BY): you may copy, share, adapt and reuse this content, also commercially, as long as you credit statistics.wiki and note any changes you made. The sources listed above may have their own license terms.