
Abortion rate by country
| Rank | Country | Abortions per 1,000 women aged 15–49 | Abortions | Year |
|---|---|---|---|---|
| 1 |  India |
46.0 | 15,644,748 | 2015 |
| 2 |  Pakistan |
45.3 | 2,250,087 | 2012 |
| 3 |  Kenya |
43.5 | 463,932 | 2012 |
| 4 |  Uganda |
40.3 | 314,304 | 2013 |
| 5 |  Bangladesh |
37.9 | 1,624,320 | 2014 |
| 6 |  Tanzania |
36.2 | 405,081 | 2013 |
| 7 |  Malawi |
35.1 | 141,044 | 2015 |
| 8 |  Colombia |
33.7 | 400,412 | 2008 |
| 9 |  Mexico |
33.5 | 1,025,669 | 2009 |
| 10 |  Nigeria |
31.7 | 1,250,117 | 2012 |
| 11 |  Cuba |
31.0 | 83,904 | 2017 |
| 12 |  China |
28.0 | 9,740,000 | 2018 |
| 13 |  Ethiopia |
26.6 | 620,296 | 2014 |
| 14 |  Cambodia |
26.3 | 103,319 | 2010 |
| 15 |  Burkina Faso |
25.1 | 87,201 | 2008 |
| 16 |  Rwanda |
24.0 | 60,276 | 2009 |
| 17 |  Russia |
23.8 | 836,600 | 2016 |
| 18 |  Mongolia |
21.2 | 17,530 | 2017 |
| 19 |  Georgia |
17.6 | 15,903 | 2017 |
| 20 |  Zimbabwe |
17.5 | 65,259 | 2016 |
| 21 |  Kazakhstan |
17.1 | 80,328 | 2017 |
| 22 |  Sweden |
16.9 | 36,616 | 2017 |
| 23 |  Senegal |
16.5 | 51,547 | 2012 |
| 24 |  France |
14.4 | 202,919 | 2017 |
| 25 |  Estonia |
14.0 | 4,017 | 2017 |
| 26 |  Azerbaijan |
13.8 | 37,600 | 2017 |
| 27 |  United Kingdom |
13.4 | 202,055 | 2017 |
| 28 |  Iceland |
13.2 | 1,044 | 2017 |
| 29 |  Botswana |
13.0 | 7,244 | 2010 |
| 30 |  Hungary |
12.6 | 28,496 | 2017 |
| 31 |  Nepal |
12.4 | 96,417 | 2017 |
| 32 |  Uruguay |
12.2 | 9,830 | 2017 |
| 33 |  New Zealand |
11.8 | 13,285 | 2017 |
| 34 |  United States |
11.5 | 862,300 | 2017 |
| 35 |  Canada |
11.3 | 94,007 | 2017 |
| 36 |  Denmark |
11.3 | 14,284 | 2018 |
| 37 |  Moldova |
11.1 | 8,802 | 2017 |
| 38 |  Vietnam |
10.7 | 277,834 | 2015 |
| 39 |  Bulgaria |
10.5 | 16,340 | 2016 |
| 40 |  Norway |
10.1 | 12,216 | 2018 |
| 41 |  Dominican Republic |
9.6 | 25,999 | 2014 |
| 42 |  Israel |
9.5 | 17,990 | 2016 |
| 43 |  Belarus |
9.3 | 20,997 | 2017 |
| 44 |  Latvia |
9.2 | 3,917 | 2017 |
| 45 |  North Macedonia |
9.1 | 4,236 | 2017 |
| 46 |  Spain |
8.9 | 94,123 | 2017 |
| 47 |  Ukraine |
8.8 | 94,665 | 2017 |
| 48 |  Czech Republic |
8.2 | 19,415 | 2017 |
| 49 |  Slovenia |
8.0 | 3,529 | 2017 |
| 50 |  Romania |
7.8 | 36,696 | 2016 |
| 51 |  Belgium |
7.7 | 19,578 | 2011 |
| 52 |  Finland |
7.5 | 8,602 | 2018 |
| 53 |  Netherlands |
7.1 | 27,041 | 2017 |
| 54 |  Slovakia |
6.9 | 9,039 | 2018 |
| 55 |  Serbia |
6.9 | 11,093 | 2016 |
| 56 |  Bhutan |
6.8 | 1,336 | 2017 |
| 57 |  Lithuania |
6.8 | 4,294 | 2017 |
| 58 |  Armenia |
6.8 | 5,229 | 2016 |
| 59 |  Portugal |
6.6 | 15,379 | 2017 |
| 60 |  South Africa |
6.6 | 104,660 | 2017 |
| 61 |  Japan |
6.4 | 164,621 | 2017 |
| 62 |  Tajikistan |
6.4 | 14,957 | 2016 |
| 63 |  Kyrgyzstan |
6.3 | 9,705 | 2017 |
| 64 |  Italy |
6.1 | 78,276 | 2017 |
| 65 |  Panama |
5.8 | 6,015 | 2016 |
| 66 |  Germany |
5.8 | 99,905 | 2018 |
| 67 |  Chile |
5.8 | 26,819 | 2016 |
| 68 |  Costa Rica |
5.6 | 7,137 | 2014 |
| 69 |  Peru |
5.6 | 42,662 | 2012 |
| 70 |  Taiwan |
5.3 | 31,743 | 2016 |
| 71 |  Switzerland |
5.1 | 9,863 | 2017 |
| 72 |  Montenegro |
5.1 | 763 | 2016 |
| 73 |  Uzbekistan |
5.0 | 42,431 | 2017 |
| 74 |  Tunisia |
4.8 | 14,699 | 2009 |
| 75 |  Singapore |
4.3 | 6,815 | 2017 |
| 76 |  Myanmar |
3.9 | 54,305 | 2016 |
| 77 |  Croatia |
2.7 | 2,416 | 2017 |
| 78 |  Bosnia |
2.2 | 1,766 | 2016 |
| 79 |  Tonga |
2.0 | 53 | 2011 |
| 80 |  Albania |
1.6 | 1,193 | 2017 |
| 81 |  Burundi |
1.3 | 3,152 | 2013 |
| 82 |  Togo |
0.9 | 1,604 | 2016 |
| 83 |  Poland |
0.1 | 1,098 | 2016 |
| Not ranked: latest data before 2008 | ||||
 Turkmenistan |
42.1 | 37,200 | 1990 | |
 Argentina |
41.0 | 371,965 | 2000 | |
 Brazil |
37.2 | 1,443,339 | 1991 | |
 South Korea |
25.9 | 342,433 | 2005 | |
 Philippines |
23.8 | 473,408 | 2000 | |
 Guatemala |
22.2 | 64,974 | 2003 | |
 Australia |
17.0 | 84,460 | 2003 | |
 Egypt |
10.1 | 161,975 | 1996 | |
 Greece |
6.1 | 16,495 | 2005 | |
Of the 83 countries in the table, the latest abortion rate is highest in India, 46.0 abortions per 1,000 women aged 15–49 (2015), and lowest in Poland, 0.1 (2016). In half of them it is below 9.5.
The abortion rate is the number of induced abortions in a year per 1,000 women aged 15–49. The numbers of abortions are the Guttmacher Institute's; the numbers of women are the United Nations' (World Population Prospects). For most countries, the latest figures are from 2016–2018; the Guttmacher Institute's data end in 2018.
Abortion rate by country map
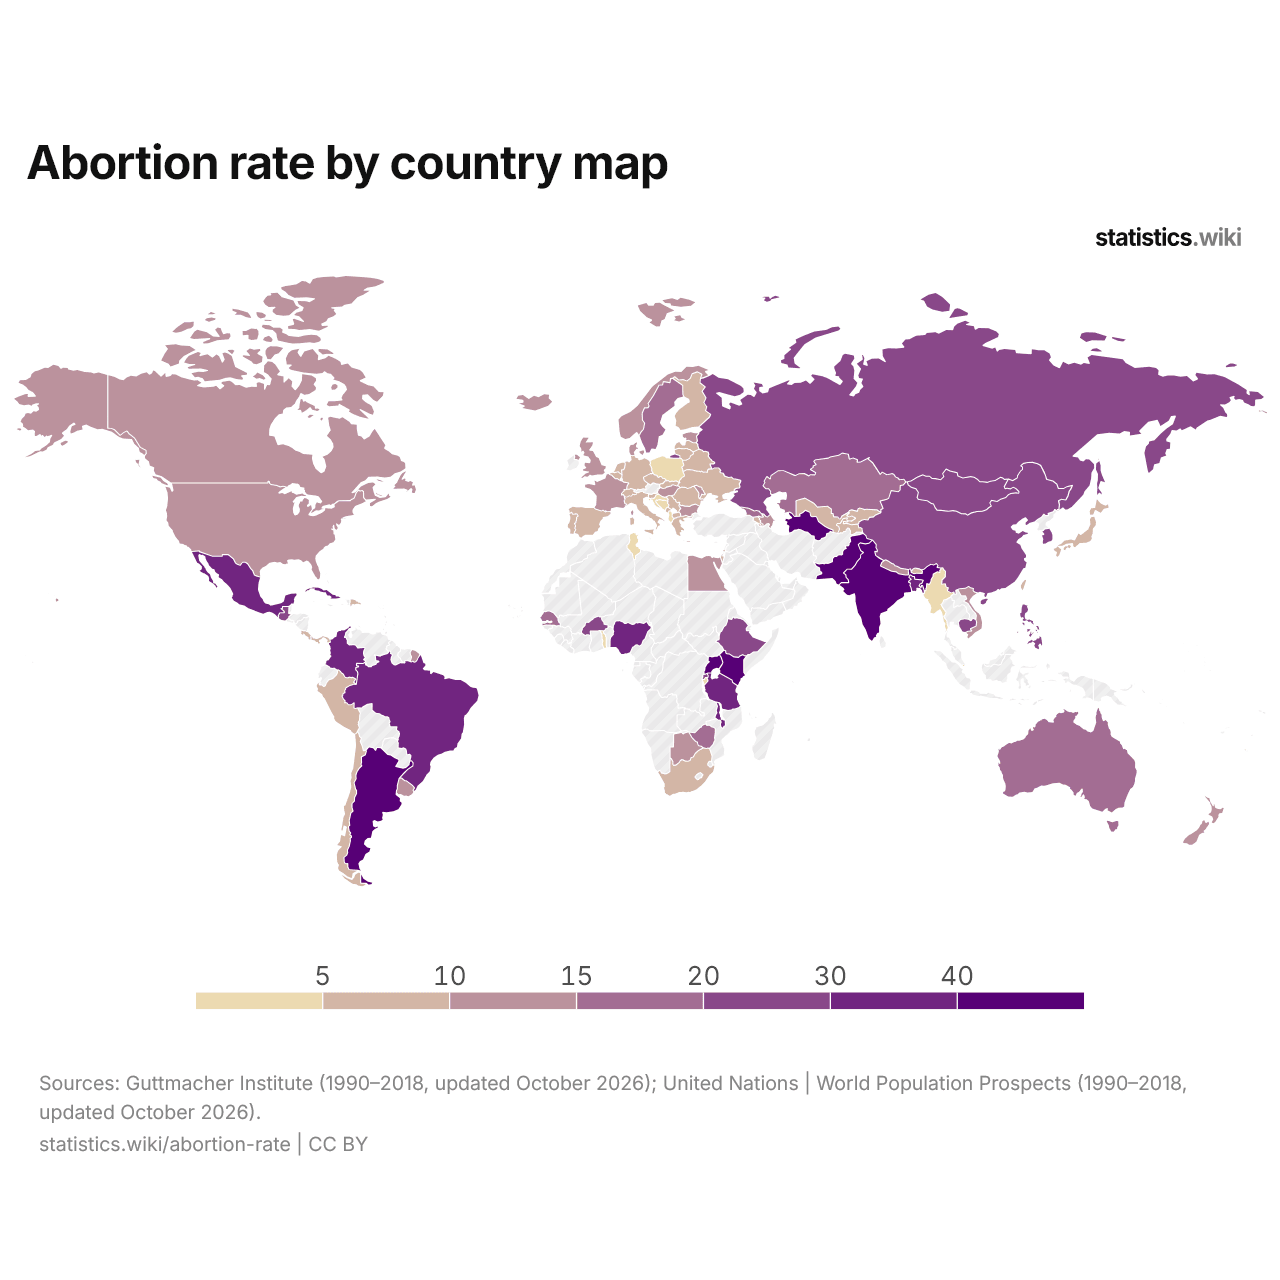
In 14 of the 92 countries, the latest abortion rate is above 30 abortions per 1,000 women aged 15–49, and in 10, it is below 5.
Abortion rate chart: 5 of the most populous countries
| Year | Per 1,000 women aged 15–49 | ||||
|---|---|---|---|---|---|
| China | Russia | United States | Japan | Germany | |
| 2018 | 28 | - | - | - | 5.79 |
| 2017 | 27.3 | - | 11.5 | 6.4 | 5.76 |
| 2016 | 27 | 23.8 | 11.7 | 6.53 | 5.63 |
| 2015 | 27.3 | 17 | 12.1 | 6.79 | 5.65 |
| 2014 | 26.3 | 19.1 | 12.5 | 6.94 | 5.63 |
| 2013 | 23.4 | 21.5 | 13 | 7.06 | 5.75 |
| 2012 | 25 | 22.8 | 13.7 | 7.4 | 5.87 |
| 2011 | 25.2 | 25.3 | 14.4 | 7.56 | 5.93 |
| 2010 | 24.7 | 26.6 | 15 | 7.9 | 5.94 |
| 2009 | 24.3 | 28.9 | 15.7 | 8.38 | 5.91 |
| 2008 | 24.8 | 31 | 16.5 | 8.89 | 6.05 |
| 2007 | 20.6 | 33.1 | 16.5 | 9.37 | 6.11 |
| 2006 | 19.7 | 35.5 | 17 | 10 | 6.11 |
| 2005 | 19.4 | 37.6 | 16.6 | 10.4 | 6.34 |
| 2004 | 19.6 | 40.3 | 16.9 | 10.8 | 6.6 |
| 2003 | 19.9 | 41.9 | 17.3 | 11.3 | 6.52 |
| 2002 | 19 | 40.1 | 17.7 | 11.6 | 6.64 |
| 2001 | 17.7 | 42.3 | 18.1 | 11.9 | 6.88 |
| 2000 | 18.9 | 45 | 18.5 | 11.7 | 6.86 |
| 1999 | 19.4 | 47.6 | 18.6 | 11.4 | 6.64 |
| 1998 | 21.3 | 51.9 | 18.8 | 11.1 | 6.58 |
| 1997 | 19.3 | 55.1 | 19.1 | 11.1 | 6.58 |
| 1996 | 26.2 | 59 | 19.5 | 11 | 6.62 |
| 1995 | 22.4 | 60 | 19.7 | 11.1 | 5 |
| 1994 | 28.8 | 67.5 | 20.8 | 11.8 | 5.3 |
| 1993 | 29.2 | 73.3 | 22 | 12.5 | 5.7 |
| 1992 | 32.4 | 80.6 | 22.7 | 13.3 | 6.11 |
| 1991 | 44.5 | 84.8 | 23.3 | 14 | 6.39 |
| 1990 | 43.3 | 112.9 | 24.3 | 14.7 | 7.43 |
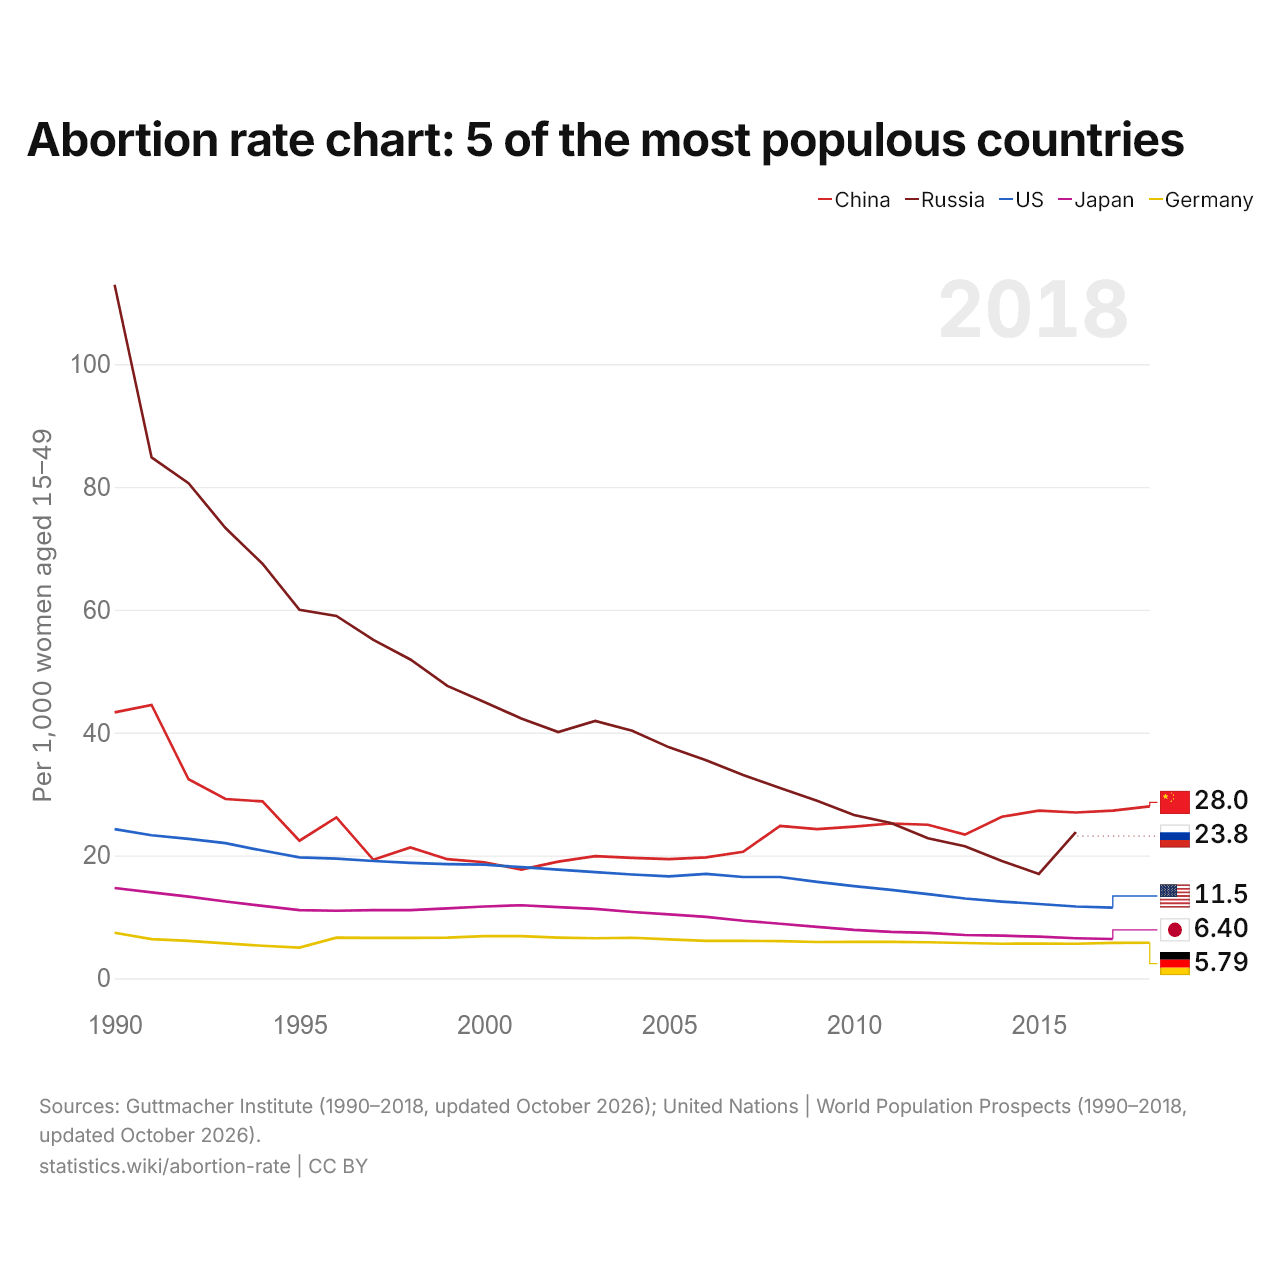
Among the five countries, the latest abortion rate is highest in China, 28.0 abortions per 1,000 women aged 15–49, and lowest in Germany, 5.8. The largest change is in Russia, where it has fallen from 112.9 in 1990 to 23.8.
Countries with the highest abortion rates
Countries with the lowest abortion rates
Of the ten countries with the highest abortion rates, five are in Africa; of the ten with the lowest, four are in Europe.
Compare the abortion rates of any 2 countries
Sources:
- Guttmacher Institute (1990–2018, updated October 2026)
- United Nations | World Population Prospects (1990–2018, updated October 2026)
Creative Commons Attribution (CC BY): you may copy, share, adapt and reuse this content, also commercially, as long as you credit statistics.wiki and note any changes you made. The sources listed above may have their own license terms.