
Russia urban population, % of total, 1960–2025
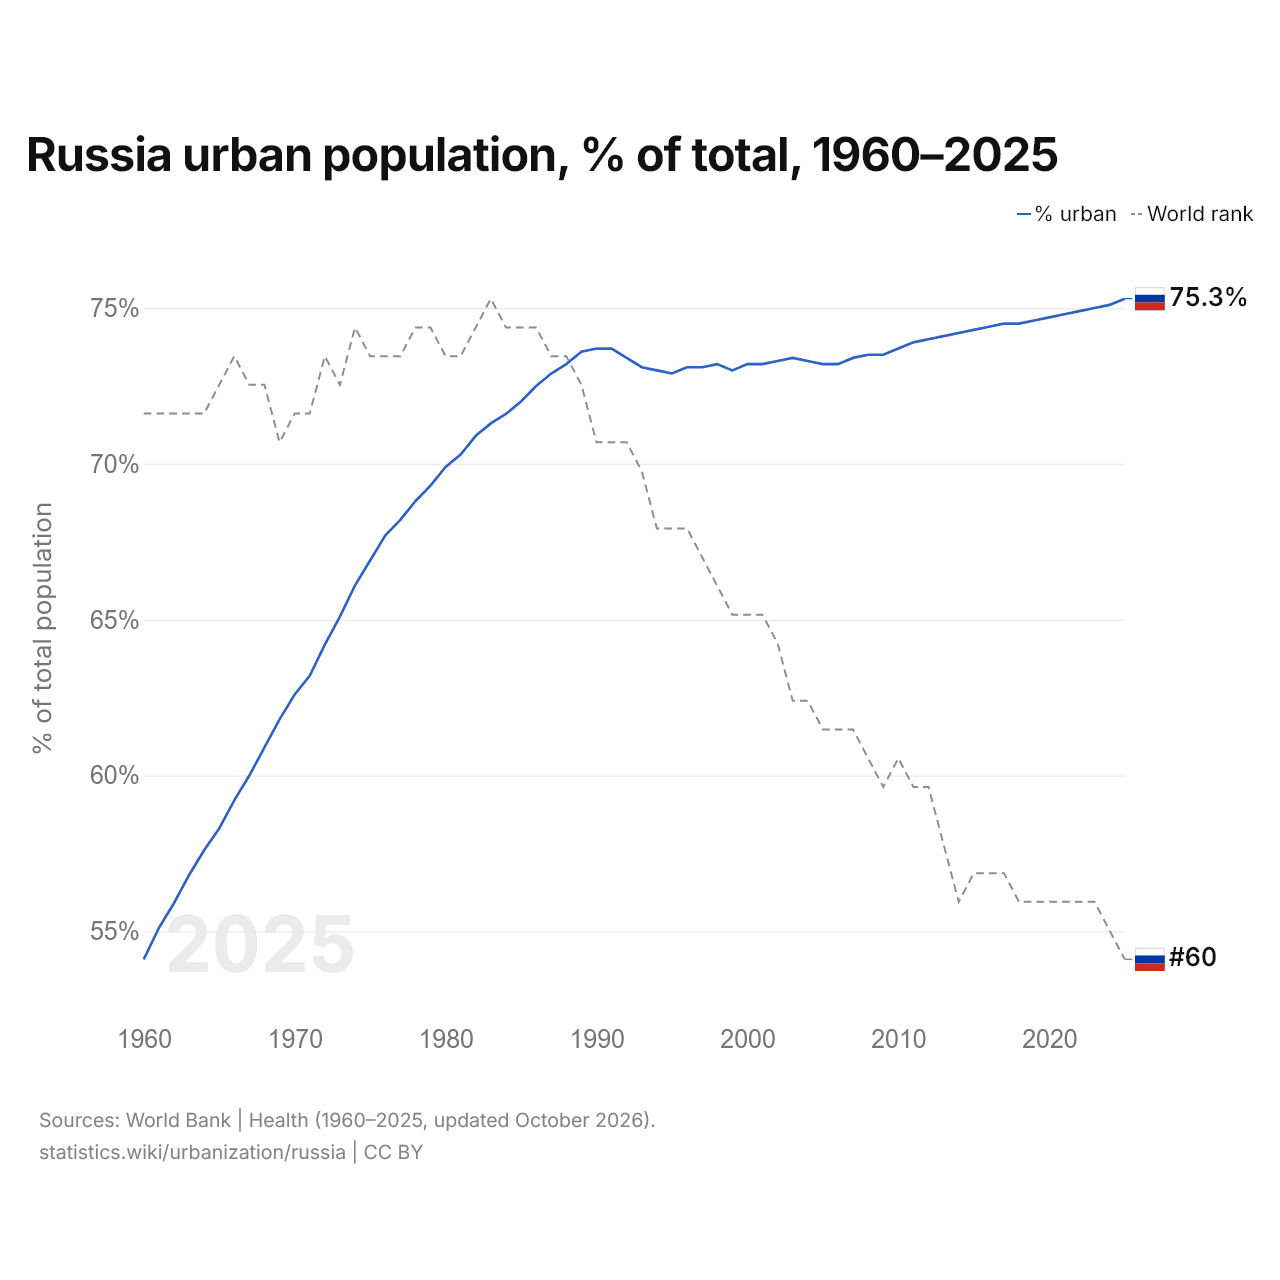
In 2025, 75.3% of Russia's population lived in urban areas, compared with 54.1% in 1960. Russia's share ranked 60th in the world, down from 59th in 2024. Russia's highest rank was 37th, last held in 1983.
Russia's urban share in 2025 was the 19th highest of 44 countries in Europe, where it ranged from Liechtenstein's 14.6% to Monaco's 100%. Russia's urban share rose most from 1960 to 1970, by 8.5 percentage points; from 2015 to 2025, it rose by 1 points.
Russia urban and rural population, 1960–2025
| Year | Population | |
|---|---|---|
| Urban population | Rural population | |
| 2025 | 107,994,732 | 35,518,596 |
| 2024 | 107,913,022 | 35,756,626 |
| 2023 | 107,841,558 | 35,984,572 |
| 2022 | 107,967,820 | 36,269,113 |
| 2021 | 108,200,642 | 36,546,120 |
| 2020 | 108,488,280 | 36,756,868 |
| 2019 | 108,540,571 | 36,912,720 |
| 2018 | 108,385,990 | 37,012,116 |
| 2017 | 108,185,415 | 37,107,845 |
| 2016 | 107,848,453 | 37,167,007 |
| 2015 | 107,433,221 | 37,207,495 |
| 2014 | 106,991,779 | 37,245,444 |
| 2013 | 106,525,889 | 37,279,749 |
| 2012 | 106,060,846 | 37,317,601 |
| 2011 | 105,623,921 | 37,394,274 |
| 2010 | 105,236,676 | 37,612,792 |
| 2009 | 104,988,452 | 37,796,896 |
| 2008 | 104,890,297 | 37,852,069 |
| 2007 | 104,798,397 | 38,006,717 |
| 2006 | 104,775,161 | 38,274,476 |
| 2005 | 105,000,362 | 38,518,452 |
| 2004 | 105,610,822 | 38,456,494 |
| 2003 | 106,180,387 | 38,468,231 |
| 2002 | 106,499,347 | 38,807,150 |
| 2001 | 106,898,549 | 39,077,933 |
| 2000 | 107,245,611 | 39,351,258 |
| 1999 | 107,415,750 | 39,799,026 |
| 1998 | 108,082,031 | 39,588,753 |
| 1997 | 108,149,295 | 39,766,066 |
| 1996 | 108,249,212 | 39,910,917 |
| 1995 | 108,218,295 | 40,157,492 |
| 1994 | 108,269,670 | 40,138,242 |
| 1993 | 108,462,642 | 39,996,135 |
| 1992 | 109,000,736 | 39,537,461 |
| 1991 | 109,380,651 | 39,013,565 |
| 1990 | 109,070,630 | 38,898,776 |
| 1989 | 108,657,016 | 39,063,984 |
| 1988 | 107,548,047 | 39,308,953 |
| 1987 | 106,330,934 | 39,577,066 |
| 1986 | 104,999,079 | 39,894,921 |
| 1985 | 103,623,539 | 40,234,461 |
| 1984 | 102,259,533 | 40,485,467 |
| 1983 | 100,997,086 | 40,670,914 |
| 1982 | 99,775,650 | 41,047,350 |
| 1981 | 98,424,085 | 41,516,915 |
| 1980 | 97,100,053 | 41,909,947 |
| 1979 | 95,708,951 | 42,318,049 |
| 1978 | 94,257,412 | 42,802,588 |
| 1977 | 92,867,763 | 43,232,237 |
| 1976 | 91,442,270 | 43,704,730 |
| 1975 | 89,829,777 | 44,370,223 |
| 1974 | 88,136,798 | 45,295,202 |
| 1973 | 86,383,378 | 46,285,622 |
| 1972 | 84,634,148 | 47,274,852 |
| 1971 | 82,946,952 | 48,208,048 |
| 1970 | 81,607,749 | 48,796,251 |
| 1969 | 80,083,165 | 49,580,835 |
| 1968 | 78,479,608 | 50,448,392 |
| 1967 | 76,975,760 | 51,220,240 |
| 1966 | 75,465,997 | 52,002,003 |
| 1965 | 73,944,310 | 52,800,690 |
| 1964 | 72,196,074 | 53,148,926 |
| 1963 | 70,385,054 | 53,574,946 |
| 1962 | 68,559,703 | 54,031,297 |
| 1961 | 66,844,618 | 54,391,382 |
| 1960 | 64,914,188 | 54,982,812 |
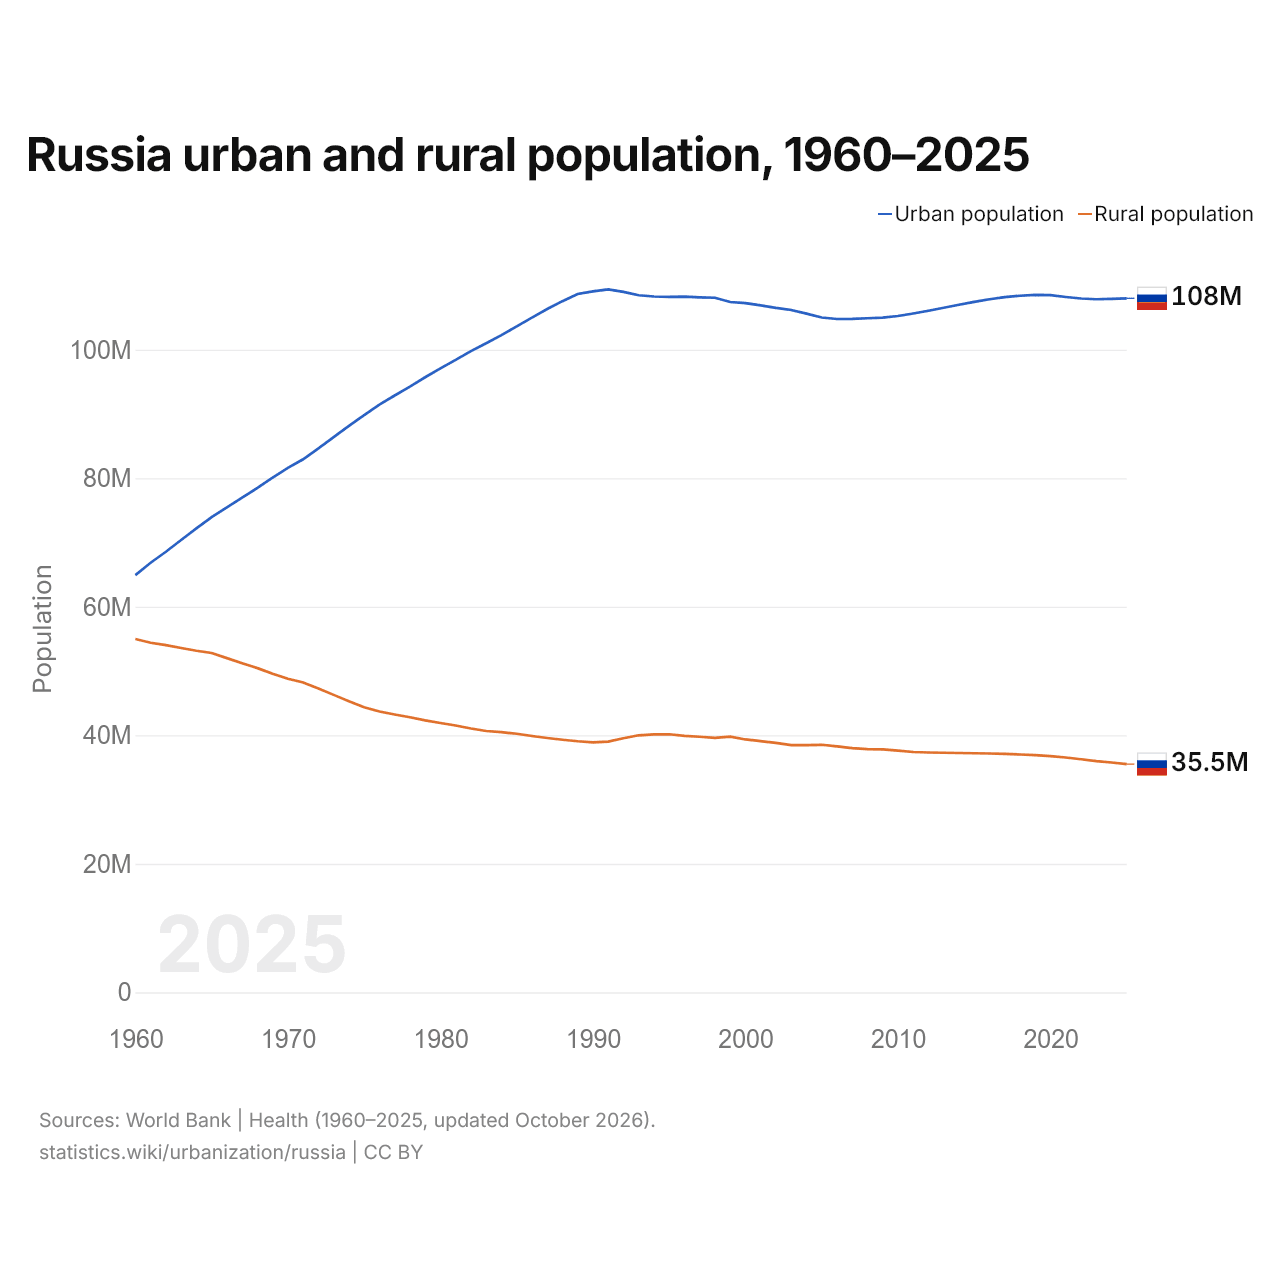
In 2025, 108 million people in Russia lived in urban areas and 35.5 million in rural areas. Russia's rural population peaked at 55 million in 1960.
Russia's urban population was 1.7 times as large in 2025 as in 1960, while its rural population fell by 35%. Russia's largest city, Moscow, had 13.3 million people in 2025.
Russia in the world ranking by urban population share, 2025
| Rank | Country | % urban | Urban population | |
|---|---|---|---|---|
| 57 |
 Cuba |
77.2% | 8,446,482 | |
| 58 |
 Algeria |
75.8% | 35,964,854 | |
| 59 |
 El Salvador |
75.5% | 4,807,464 | |
| 60 |
 Russia |
75.3% | 107,994,732 | |
| 61 |
 Brunei |
75.0% | 349,799 | |
| 62 |
 Finland |
74.5% | 4,207,994 | vs Finland |
| 63 |
 Bulgaria |
74.2% | 4,771,757 | vs Bulgaria |
Compare Russia urban population with other countries
Sources:
- World Bank | Health (1960–2025, updated October 2026)
Creative Commons Attribution (CC BY): you may copy, share, adapt and reuse this content, also commercially, as long as you credit statistics.wiki and note any changes you made. The sources listed above may have their own license terms.