
Expectativa de vida em Portugal, 1950–2026
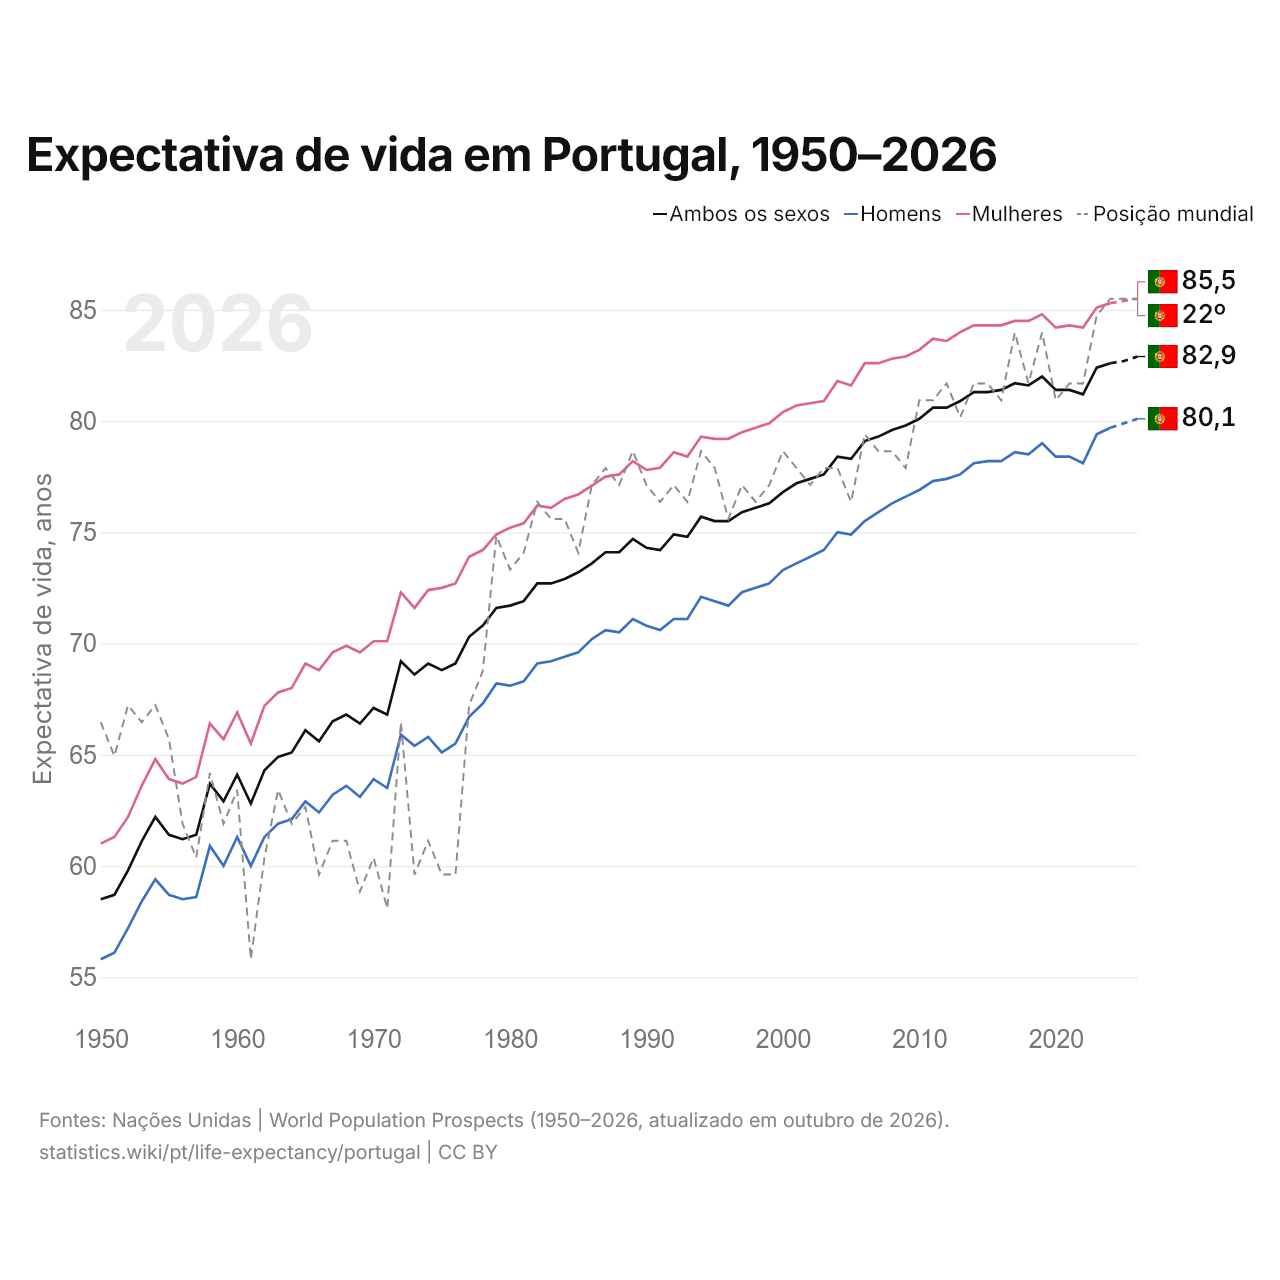
| Ano | Expectativa de vida, anos | Posição mundial | ||
|---|---|---|---|---|
| Ambos os sexos | Homens | Mulheres | ||
| 2026 projeção | 82,9 | 80,1 | 85,5 | 22º |
| 2025 projeção | 82,7 | 79,9 | 85,4 | 22º |
| 2024 | 82,6 | 79,7 | 85,3 | 22º |
| 2023 | 82,4 | 79,4 | 85,1 | 23º |
| 2022 | 81,2 | 78,1 | 84,2 | 27º |
| 2021 | 81,4 | 78,4 | 84,3 | 27º |
| 2020 | 81,4 | 78,4 | 84,2 | 28º |
| 2019 | 82 | 79 | 84,8 | 24º |
| 2018 | 81,6 | 78,5 | 84,5 | 27º |
| 2017 | 81,7 | 78,6 | 84,5 | 24º |
| 2016 | 81,4 | 78,2 | 84,3 | 28º |
| 2015 | 81,3 | 78,2 | 84,3 | 27º |
| 2014 | 81,3 | 78,1 | 84,3 | 27º |
| 2013 | 80,9 | 77,6 | 84 | 29º |
| 2012 | 80,6 | 77,4 | 83,6 | 27º |
| 2011 | 80,6 | 77,3 | 83,7 | 28º |
| 2010 | 80,1 | 76,9 | 83,2 | 28º |
| 2009 | 79,8 | 76,6 | 82,9 | 32º |
| 2008 | 79,6 | 76,3 | 82,8 | 31º |
| 2007 | 79,3 | 75,9 | 82,6 | 31º |
| 2006 | 79,1 | 75,5 | 82,6 | 30º |
| 2005 | 78,3 | 74,9 | 81,6 | 34º |
| 2004 | 78,4 | 75 | 81,8 | 32º |
| 2003 | 77,6 | 74,2 | 80,9 | 32º |
| 2002 | 77,4 | 73,9 | 80,8 | 33º |
| 2001 | 77,2 | 73,6 | 80,7 | 32º |
| 2000 | 76,8 | 73,3 | 80,4 | 31º |
| 1999 | 76,3 | 72,7 | 79,9 | 33º |
| 1998 | 76,1 | 72,5 | 79,7 | 34º |
| 1997 | 75,9 | 72,3 | 79,5 | 33º |
| 1996 | 75,5 | 71,7 | 79,2 | 35º |
| 1995 | 75,5 | 71,9 | 79,2 | 32º |
| 1994 | 75,7 | 72,1 | 79,3 | 31º |
| 1993 | 74,8 | 71,1 | 78,4 | 34º |
| 1992 | 74,9 | 71,1 | 78,6 | 33º |
| 1991 | 74,2 | 70,6 | 77,9 | 34º |
| 1990 | 74,3 | 70,8 | 77,8 | 33º |
| 1989 | 74,7 | 71,1 | 78,2 | 31º |
| 1988 | 74,1 | 70,5 | 77,6 | 33º |
| 1987 | 74,1 | 70,6 | 77,5 | 32º |
| 1986 | 73,6 | 70,2 | 77,1 | 33º |
| 1985 | 73,2 | 69,6 | 76,7 | 37º |
| 1984 | 72,9 | 69,4 | 76,5 | 35º |
| 1983 | 72,7 | 69,2 | 76,1 | 35º |
| 1982 | 72,7 | 69,1 | 76,2 | 34º |
| 1981 | 71,9 | 68,3 | 75,4 | 37º |
| 1980 | 71,7 | 68,1 | 75,2 | 38º |
| 1979 | 71,6 | 68,2 | 74,9 | 36º |
| 1978 | 70,8 | 67,3 | 74,2 | 44º |
| 1977 | 70,3 | 66,7 | 73,9 | 46º |
| 1976 | 69,1 | 65,5 | 72,7 | 56º |
| 1975 | 68,8 | 65,1 | 72,5 | 56º |
| 1974 | 69,1 | 65,8 | 72,4 | 54º |
| 1973 | 68,6 | 65,4 | 71,6 | 56º |
| 1972 | 69,2 | 65,9 | 72,3 | 47º |
| 1971 | 66,8 | 63,5 | 70,1 | 58º |
| 1970 | 67,1 | 63,9 | 70,1 | 55º |
| 1969 | 66,4 | 63,1 | 69,6 | 57º |
| 1968 | 66,8 | 63,6 | 69,9 | 54º |
| 1967 | 66,5 | 63,2 | 69,6 | 54º |
| 1966 | 65,6 | 62,4 | 68,8 | 56º |
| 1965 | 66,1 | 62,9 | 69,1 | 52º |
| 1964 | 65,1 | 62,1 | 68 | 53º |
| 1963 | 64,9 | 61,9 | 67,8 | 51º |
| 1962 | 64,3 | 61,3 | 67,2 | 55º |
| 1961 | 62,8 | 60 | 65,5 | 61º |
| 1960 | 64,1 | 61,3 | 66,9 | 51º |
| 1959 | 62,9 | 60 | 65,7 | 53º |
| 1958 | 63,7 | 60,9 | 66,4 | 50º |
| 1957 | 61,4 | 58,6 | 64 | 55º |
| 1956 | 61,2 | 58,5 | 63,7 | 53º |
| 1955 | 61,4 | 58,7 | 63,9 | 48º |
| 1954 | 62,2 | 59,4 | 64,8 | 46º |
| 1953 | 61,1 | 58,4 | 63,6 | 47º |
| 1952 | 59,8 | 57,2 | 62,2 | 46º |
| 1951 | 58,7 | 56,1 | 61,3 | 49º |
| 1950 | 58,5 | 55,8 | 61 | 47º |
Em 2026, a expectativa de vida ao nascer em Portugal é de 82,9 anos: 85,5 anos para as mulheres e 80,1 para os homens. É a 22ª mais alta do mundo, posição que mantém desde 2024. Em 1950, era de 58,5 anos.
A expectativa de vida de Portugal é a 15ª mais alta dos 45 países da Europa, onde vai de 71,6 anos na Moldávia a 86,7 anos em Mônaco. A expectativa de vida de Portugal passou dos 80 anos em 2010. A maior alta da expectativa de vida de Portugal em dez anos foi a de 1950 a 1960, de 5,6 anos.
A expectativa de vida saudável ao nascer em Portugal é de 69,8 anos, a 19ª mais alta do mundo. Em 2026, uma pessoa de 65 anos em Portugal pode esperar viver mais 21,2 anos, a 17ª maior expectativa de vida aos 65 anos do mundo.
Portugal na classificação mundial de expectativa de vida, 2026
| Posição | País | Expectativa de vida | Homens | Mulheres | Diferença entre mulheres e homens | Variação desde 2000 | |
|---|---|---|---|---|---|---|---|
| 19 |
 Canadá |
83,1 | 80,9 | 85,2 | 4,2 | +3,8 | vs Canadá |
| 20 |
 Irlanda |
82,9 | 81,0 | 84,9 | 3,9 | +6,4 | vs Irlanda |
| 21 |
 Israel |
82,9 | 80,8 | 84,9 | 4,1 | +3,7 | vs Israel |
| 22 |
 Portugal |
82,9 | 80,1 | 85,5 | 5,4 | +6,1 | |
| 23 |
 Catar |
82,8 | 82,1 | 83,7 | 1,6 | +7,6 | vs Catar |
| 24 |
 Luxemburgo |
82,6 | 81,1 | 84,2 | 3,1 | +5,4 | vs Luxemburgo |
| 25 |
 Países Baixos |
82,6 | 81,1 | 84,1 | 3,0 | +4,5 | vs Países Baixos |
Comparar a expectativa de vida em Portugal com a de outros países
Fontes:
- Nações Unidas | World Population Prospects (1950–2026, atualizado em outubro de 2026)
Creative Commons Atribuição (CC BY): você pode copiar, compartilhar, adaptar e reutilizar este conteúdo, inclusive para fins comerciais, desde que cite o statistics.wiki e indique as alterações que fizer. As fontes listadas acima podem ter suas próprias condições de licença.