
PIB por trabalhador por país, 2025
| Posição | País | PIB por trabalhador (PPC) | Crescimento real anual, 2015–2025 |
|---|---|---|---|
 Mundo |
US$ 51.458 (2022) | +1,8% (2012–2022) | |
| 1 |  Luxemburgo |
US$ 323.019 | −0,6% |
| 2 |  Irlanda |
US$ 306.231 | +3,5% |
| 3 |  Singapura |
US$ 274.424 | +2,2% |
| 4 |  Guiana |
US$ 219.984 (2024) | n/d |
| 5 |  Noruega |
US$ 197.422 | +0,7% |
| 6 |  Brunei |
US$ 191.540 | n/d |
| 7 |  Suíça |
US$ 189.620 | +1,1% |
| 8 |  Estados Unidos |
US$ 183.867 | +1,5% |
| 9 |  Bélgica |
US$ 173.981 | +0,4% |
| 10 |  Catar |
US$ 171.236 (2024) | −1,4% (2014–2024) |
| 11 |  Dinamarca |
US$ 162.008 | +0,9% |
| 12 |  Países Baixos |
US$ 158.753 | +0,6% |
| 13 |  Áustria |
US$ 157.863 | +0,5% |
| 14 |  Itália |
US$ 153.613 | +0,2% |
| 15 |  Arábia Saudita |
US$ 153.361 | −0,5% |
| 16 |  Alemanha |
US$ 150.316 | +0,5% |
| 17 |  França |
US$ 149.489 | +0,4% |
| 18 |  Suécia |
US$ 147.714 | +0,7% |
| 19 |  Finlândia |
US$ 142.557 | +0,2% |
| 20 |  Islândia |
US$ 141.263 | +0,9% |
| 21 |  Austrália |
US$ 137.045 | +0,2% |
| 22 |  Malta |
US$ 133.655 | +1,4% |
| 23 |  Espanha |
US$ 133.348 | −0,1% |
| 24 |  Reino Unido |
US$ 133.311 | +0,6% |
| 25 |  Canadá |
US$ 130.590 | +0,5% |
| 26 |  Israel |
US$ 129.066 | +1,3% |
| 27 |  Eslovênia |
US$ 125.200 | +1,9% |
| 28 |  Romênia |
US$ 125.049 | +3,3% |
| 29 |  EAU |
US$ 122.814 (2024) | n/d |
| 30 |  Tchéquia |
US$ 121.433 | +1,2% |
| 31 |  Croácia |
US$ 118.993 | +2,8% |
| 32 |  Turquia |
US$ 115.057 | +2,5% |
| 33 |  Lituânia |
US$ 113.453 | +2,4% |
| 34 |  Coreia do Sul |
US$ 112.376 | +1,4% |
| 35 |  Polônia |
US$ 112.172 | +3,2% |
| 36 |  Portugal |
US$ 111.376 | +0,9% |
| 37 |  Grécia |
US$ 109.654 | −0,3% |
| 38 |  Nova Zelândia |
US$ 104.780 | +0,1% |
| 39 |  Eslováquia |
US$ 102.194 | +1,2% |
| 40 |  Estônia |
US$ 101.993 | +0,9% |
| 41 |  Rússia |
US$ 101.598 | +1,8% |
| 42 |  Japão |
US$ 100.933 | −0,1% |
| 43 |  Hungria |
US$ 100.493 | +1,7% |
| 44 |  Letônia |
US$ 96.534 | +2,0% |
| 45 |  Bulgária |
US$ 95.914 | +2,8% |
| 46 |  Panamá |
US$ 95.677 | +2,1% |
| 47 |  Chipre |
US$ 86.481 | +2,3% |
| 48 |  Bahrein |
US$ 85.444 (2015) | −1,0% (2005–2015) |
| 49 |  Omã |
US$ 84.081 (2024) | n/d |
| 50 |  Montenegro |
US$ 80.758 (2024) | +1,1% (2014–2024) |
| 51 |  Gabão |
US$ 80.022 (2024) | n/d |
| 52 |  Chile |
US$ 79.742 | +0,9% |
| 53 |  Trindade e Tobago |
US$ 79.247 (2024) | −1,2% (2014–2024) |
| 54 |  Uruguai |
US$ 77.494 | +0,8% |
| 55 |  Costa Rica |
US$ 76.651 | +3,1% |
| 56 |  Cazaquistão |
US$ 76.395 (2022) | +2,0% (2012–2022) |
| 57 |  Kuwait |
US$ 75.076 (2016) | −4,2% (2006–2016) |
| 58 |  Bahamas |
US$ 73.951 (2024) | −0,1% (2014–2024) |
| 59 |  Macedônia do Norte |
US$ 73.083 | +1,0% |
| 60 |  Sérvia |
US$ 72.137 | +1,5% |
| 61 |  Argentina |
US$ 71.945 | n/d |
| 62 |  Malásia |
US$ 70.078 (2022) | +1,6% (2012–2022) |
| 63 |  Líbano |
US$ 69.440 (2019) | −0,7% (2009–2019) |
| 64 |  Bósnia |
US$ 67.729 | +1,9% |
| 65 |  Bielorrússia |
US$ 67.486 | +1,9% |
| 66 |  Maurício |
US$ 67.349 (2024) | +2,0% (2014–2024) |
| 67 |  Irã |
US$ 67.322 (2024) | +0,8% (2014–2024) |
| 68 |  Egito |
US$ 67.036 (2024) | +2,2% (2014–2024) |
| 69 |  República [...] |
US$ 63.291 | +2,0% |
| 70 |  Geórgia |
US$ 62.658 | +4,8% |
| 71 |  Iraque |
US$ 61.825 (2021) | n/d |
| 72 |  Djibuti |
US$ 61.088 | n/d |
| 73 |  Botsuana |
US$ 58.612 (2024) | n/d |
| 74 |  México |
US$ 56.757 | −0,6% |
| 75 |  África do Sul |
US$ 55.495 (2024) | −0,5% (2014–2024) |
| 76 |  Santa Lúcia |
US$ 54.968 | n/d |
| 77 |  Albânia |
US$ 54.785 (2024) | +1,6% (2014–2024) |
| 78 |  Mongólia |
US$ 53.822 | +2,8% |
| 79 |  Jordânia |
US$ 51.640 (2024) | −1,6% (2014–2024) |
| 80 |  Argélia |
US$ 51.543 (2017) | +1,1% (2007–2017) |
| 81 |  Essuatíni |
US$ 50.635 (2023) | n/d |
| 82 |  Brasil |
US$ 48.891 | +0,4% |
| 83 |  Colômbia |
US$ 48.744 | +1,1% |
| 84 |  Armênia |
US$ 48.696 (2023) | +4,0% (2013–2023) |
| 85 |  Barbados |
US$ 48.565 (2024) | +0,1% (2014–2024) |
| 86 |  Maldivas |
US$ 48.513 (2019) | −0,5% (2009–2019) |
| 87 |  Tunísia |
US$ 47.849 (2023) | +0,4% (2013–2023) |
| 88 |  Azerbaijão |
US$ 47.815 (2022) | +0,4% (2012–2022) |
| 89 |  Guiné Equatorial |
US$ 47.566 (2023) | n/d |
| 90 |  Namíbia |
US$ 46.990 (2023) | +1,5% (2013–2023) |
| 91 |  Tailândia |
US$ 46.278 | +1,7% |
| 92 |  China |
US$ 44.250 (2022) | +6,6% (2012–2022) |
| 93 |  Sri Lanka |
US$ 43.304 (2024) | +0,9% (2014–2024) |
| 94 |  Paraguai |
US$ 42.010 | +1,2% |
| 95 |  Ucrânia |
US$ 40.308 (2021) | +0,1% (2011–2021) |
| 96 |  Butão |
US$ 39.276 | +2,0% |
| 97 |  Fiji |
US$ 39.191 (2024) | +1,8% (2014–2024) |
| 98 |  Suriname |
US$ 39.061 (2016) | n/d |
| 99 |  Guatemala |
US$ 37.837 | +1,2% |
| 100 |  Peru |
US$ 35.337 | +1,0% |
| 101 |  Equador |
US$ 35.280 | −0,2% |
| 102 |  Belize |
US$ 35.057 (2020) | n/d |
| 103 |  Moldávia |
US$ 34.821 | +3,7% |
| 104 |  Marrocos |
US$ 32.861 (2022) | +2,2% (2012–2022) |
| 105 |  Indonésia |
US$ 31.344 (2023) | +2,6% (2013–2023) |
| 106 |  El Salvador |
US$ 30.931 | +1,0% |
| 107 |  Vietnã |
US$ 29.639 (2024) | +5,6% (2014–2024) |
| 108 |  Palestina |
US$ 29.558 (2022) | −0,9% (2012–2022) |
| 109 |  Índia |
US$ 29.158 | n/d |
| 110 |  Angola |
US$ 27.364 | n/d |
| 111 |  Filipinas |
US$ 27.318 (2024) | +2,6% (2014–2024) |
| 112 |  Mauritânia |
US$ 27.238 (2019) | n/d |
| 113 |  Samoa |
US$ 27.180 (2022) | +2,2% (2012–2022) |
| 114 |  São Tomé |
US$ 26.659 (2017) | n/d |
| 115 |  Tonga |
US$ 24.378 (2023) | n/d |
| 116 |  Uzbequistão |
US$ 24.146 (2020) | +4,7% (2010–2020) |
| 117 |  Bolívia |
US$ 23.803 | −2,1% |
| 118 |  Cabo Verde |
US$ 23.696 (2019) | +1,4% (2009–2019) |
| 119 |  Bangladesh |
US$ 23.635 (2024) | n/d |
| 120 |  Gana |
US$ 23.546 | +3,6% |
| 121 |  Jamaica |
US$ 23.241 (2023) | −1,1% (2013–2023) |
| 122 |  Paquistão |
US$ 21.174 | +1,8% |
| 123 |  Honduras |
US$ 20.974 | +1,9% |
| 124 |  Quirguistão |
US$ 19.750 (2023) | +2,2% (2013–2023) |
| 125 |  Laos |
US$ 19.459 (2022) | n/d |
| 126 |  Nigéria |
US$ 19.353 (2024) | −2,0% (2014–2024) |
| 127 |  Senegal |
US$ 17.677 | +0,3% |
| 128 |  Zimbábue |
US$ 17.615 | n/d |
| 129 |  Costa do Marfim |
US$ 17.556 (2022) | +3,3% (2012–2022) |
| 130 |  Sudão |
US$ 16.363 (2022) | n/d |
| 131 |  Camboja |
US$ 15.204 | +3,5% |
| 132 |  Quênia |
US$ 14.881 (2022) | n/d |
| 133 |  Nepal |
US$ 14.879 (2017) | n/d |
| 134 |  Nicarágua |
US$ 13.955 (2018) | +0,9% (2008–2018) |
| 135 |  Gâmbia |
US$ 13.937 | n/d |
| 136 |  Timor-Leste |
US$ 13.414 (2022) | n/d |
| 137 |  Papua-Nova Guiné |
US$ 13.259 (2022) | n/d |
| 138 |  Camarões |
US$ 13.154 (2021) | n/d |
| 139 |  Mianmar |
US$ 12.942 (2020) | n/d |
| 140 |  Vanuatu |
US$ 12.732 | n/d |
| 141 |  Zâmbia |
US$ 12.348 (2024) | n/d |
| 142 |  Tajiquistão |
US$ 11.525 (2016) | +6,0% (2006–2016) |
| 143 |  Ruanda |
US$ 10.972 | n/d |
| 144 |  Guiné |
US$ 10.737 (2019) | n/d |
| 145 |  Comores |
US$ 10.543 (2021) | n/d |
| 146 |  Lesoto |
US$ 10.046 (2024) | n/d |
| 147 |  Afeganistão |
US$ 9.962 (2021) | n/d |
| 148 |  Togo |
US$ 9.915 (2022) | n/d |
| 149 |  Mali |
US$ 9.614 (2024) | +1,1% (2014–2024) |
| 150 |  Somália |
US$ 9.266 (2022) | n/d |
| 151 |  Tanzânia |
US$ 9.230 | n/d |
| 152 |  Benin |
US$ 8.855 (2022) | n/d |
| 153 |  Chade |
US$ 8.611 (2022) | n/d |
| 154 |  Serra Leoa |
US$ 8.384 (2018) | n/d |
| 155 |  Burkina Faso |
US$ 8.027 | n/d |
| 156 |  Guiné-Bissau |
US$ 7.321 (2022) | n/d |
| 157 |  Etiópia |
US$ 6.587 (2021) | n/d |
| 158 |  Uganda |
US$ 6.343 (2021) | +0,7% (2011–2021) |
| 159 |  Malaui |
US$ 5.894 (2024) | n/d |
| 160 |  Níger |
US$ 4.424 (2022) | +1,2% (2012–2022) |
| 161 |  Libéria |
US$ 3.977 (2017) | +1,5% (2007–2017) |
| 162 |  Moçambique |
US$ 3.911 (2022) | n/d |
| 163 |  Madagascar |
US$ 3.450 (2022) | −0,3% (2012–2022) |
| 164 |  RDC |
US$ 3.229 (2020) | n/d |
| 165 |  Burundi |
US$ 2.295 (2020) | n/d |
| Sem posição: dados mais recentes anteriores a 2015 | |||
 Venezuela |
US$ 50.998 (2011) | +0,9% (2001–2011) | |
 Turcomenistão |
US$ 28.801 (2010) | n/d | |
 São Vicente [...] |
US$ 27.533 (2008) | n/d | |
 Iêmen |
US$ 19.546 (2010) | n/d | |
 República do Congo |
US$ 16.797 (2012) | n/d | |
 Sudão do Sul |
US$ 7.918 (2008) | n/d | |
 Haiti |
US$ 7.769 (2012) | n/d | |
 Ilhas Salomão |
US$ 4.804 (2013) | n/d | |
A lista classifica 165 países pelo PIB por trabalhador (PPC) mais recente: o maior é o do Luxemburgo (323.019 dólares) e o menor, o do Burundi (2.295 dólares, 2020). O PIB por trabalhador (PPC) mundial é de 51.458 dólares (2022). Metade dos países tem PIB por trabalhador (PPC) abaixo de 48.744 dólares.
A produtividade do trabalho é aqui o PIB por trabalhador, não por hora trabalhada: o produto interno bruto de um país dividido pelo número de pessoas ocupadas. O PIB é convertido em dólares internacionais pela paridade do poder de compra (PPC), que avalia os bens e serviços de todos os países aos mesmos preços, por isso a comparação é de quanto um trabalhador produz, e não das taxas de câmbio. O crescimento real é a variação média anual do PIB por trabalhador a preços constantes, sem o efeito da alta dos preços.
Mapa da produtividade do trabalho: PIB por trabalhador por país
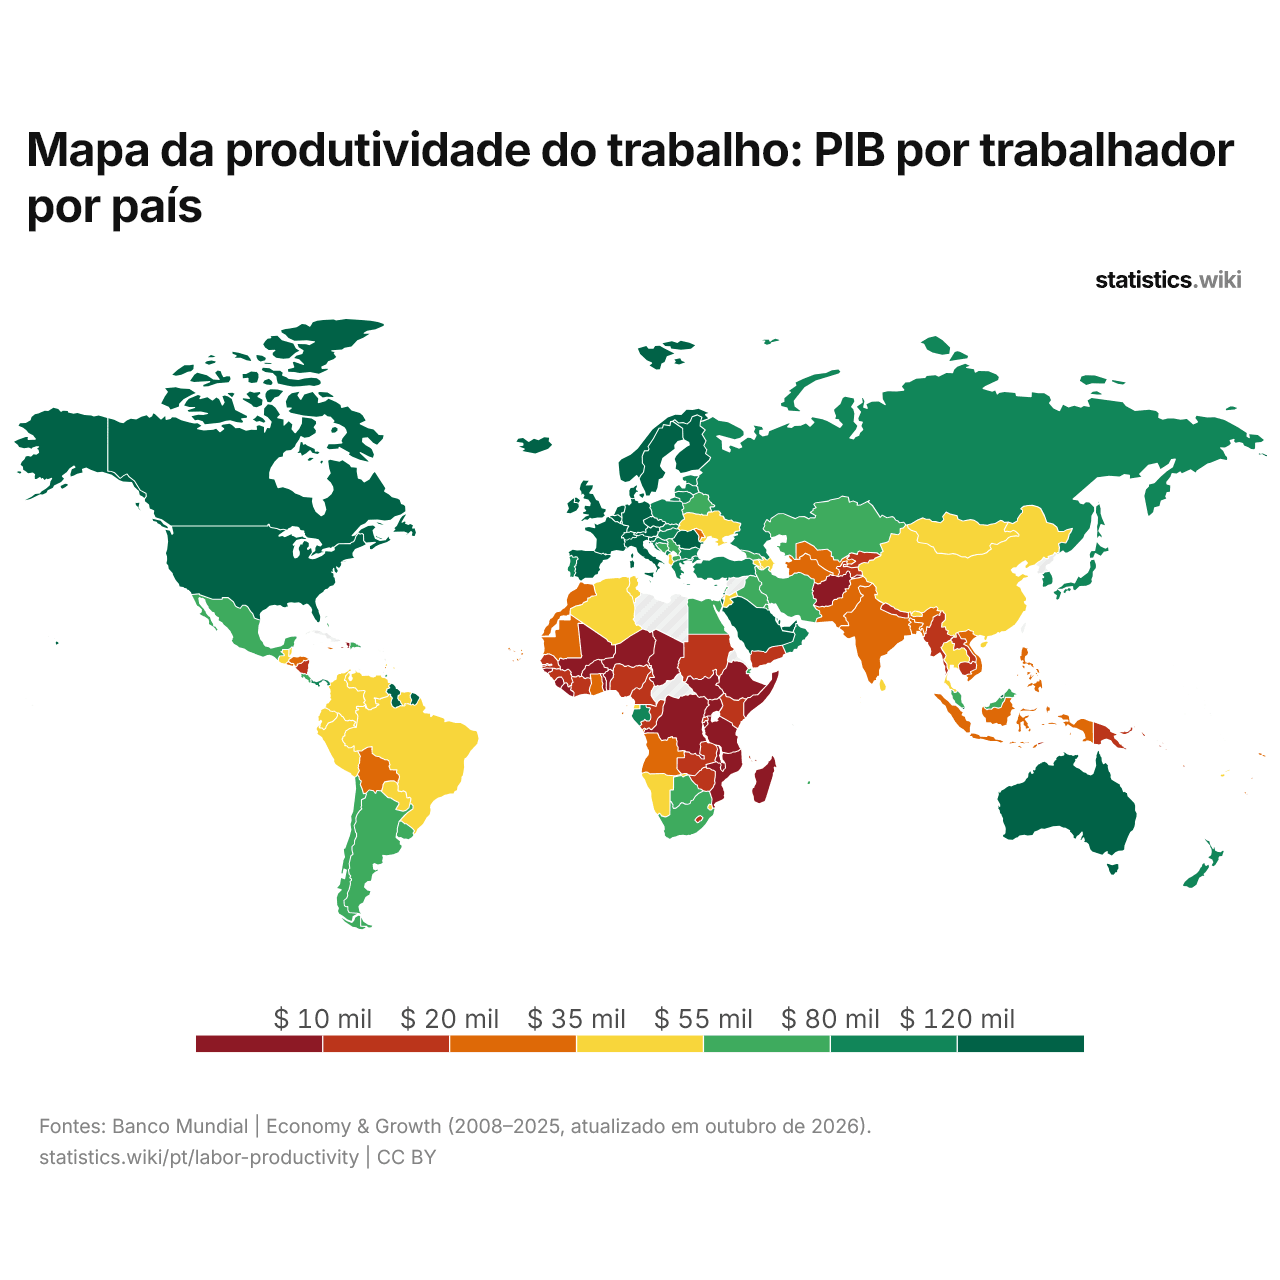
No ano mais recente de cada país, o PIB por trabalhador (PPC) fica abaixo de 10.000 dólares em 22 países e acima de 80.000 dólares em 51.
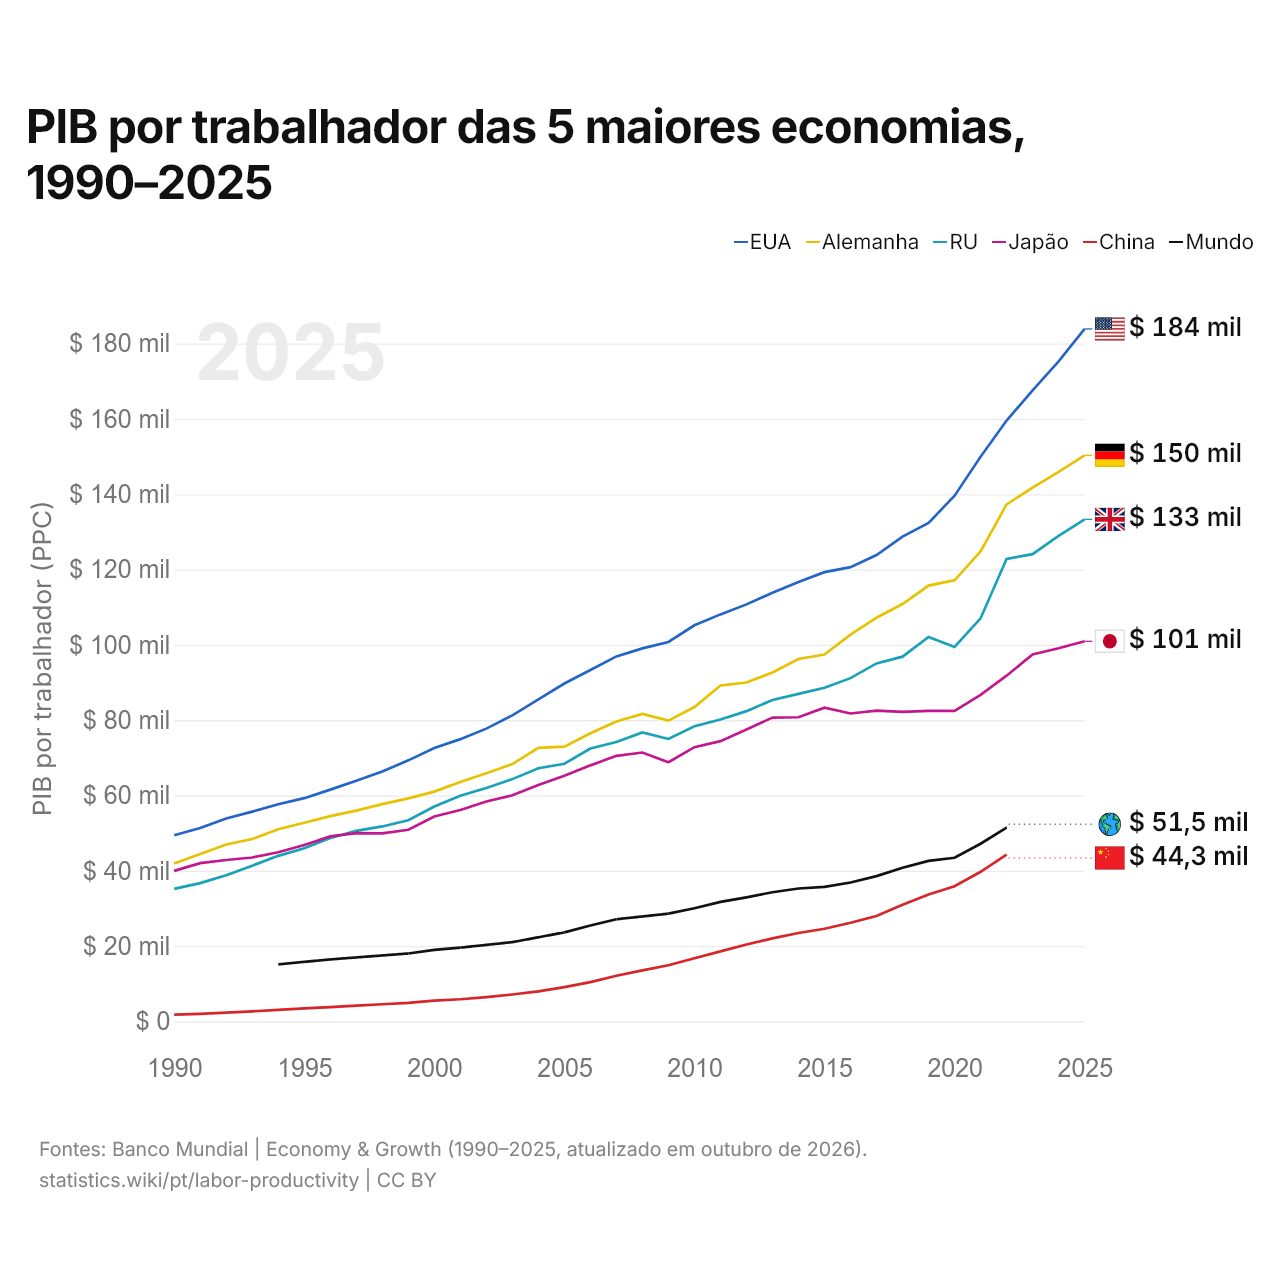
PIB por trabalhador das 5 maiores economias, 1990–2025
| Ano | PIB por trabalhador (PPC) | |||||
|---|---|---|---|---|---|---|
| Estados Unidos | Alemanha | Reino Unido | Japão | China | Mundo | |
| 2025 | $ 183.867 | $ 150.316 | $ 133.311 | $ 100.933 | - | - |
| 2024 | $ 175.268 | $ 145.922 | $ 128.890 | $ 99.079 | - | - |
| 2023 | $ 167.532 | $ 141.720 | $ 124.066 | $ 97.397 | - | - |
| 2022 | $ 159.553 | $ 137.283 | $ 122.817 | $ 91.791 | $ 44.250 | $ 51.458 |
| 2021 | $ 149.935 | $ 124.802 | $ 107.012 | $ 86.719 | $ 39.713 | $ 47.165 |
| 2020 | $ 139.572 | $ 117.102 | $ 99.404 | $ 82.423 | $ 35.892 | $ 43.427 |
| 2019 | $ 132.372 | $ 115.714 | $ 102.088 | $ 82.438 | $ 33.667 | $ 42.616 |
| 2018 | $ 128.705 | $ 110.813 | $ 96.845 | $ 82.164 | $ 30.955 | $ 40.770 |
| 2017 | $ 123.825 | $ 107.190 | $ 95.045 | $ 82.495 | $ 27.975 | $ 38.565 |
| 2016 | $ 120.616 | $ 102.677 | $ 91.136 | $ 81.757 | $ 26.161 | $ 36.878 |
| 2015 | $ 119.281 | $ 97.418 | $ 88.590 | $ 83.276 | $ 24.595 | $ 35.698 |
| 2014 | $ 116.646 | $ 96.219 | $ 86.945 | $ 80.745 | $ 23.468 | $ 35.281 |
| 2013 | $ 113.811 | $ 92.639 | $ 85.330 | $ 80.662 | $ 22.038 | $ 34.289 |
| 2012 | $ 110.723 | $ 89.972 | $ 82.374 | $ 77.511 | $ 20.419 | $ 32.935 |
| 2011 | $ 108.069 | $ 89.196 | $ 80.146 | $ 74.399 | $ 18.582 | $ 31.720 |
| 2010 | $ 105.180 | $ 83.462 | $ 78.354 | $ 72.802 | $ 16.756 | $ 30.022 |
| 2009 | $ 100.753 | $ 79.846 | $ 74.985 | $ 68.811 | $ 14.889 | $ 28.592 |
| 2008 | $ 99.048 | $ 81.634 | $ 76.703 | $ 71.383 | $ 13.533 | - |
| 2007 | $ 96.914 | $ 79.610 | $ 74.171 | $ 70.498 | $ 12.116 | $ 27.115 |
| 2006 | $ 93.292 | $ 76.503 | $ 72.460 | $ 67.972 | $ 10.414 | $ 25.441 |
| 2005 | $ 89.718 | $ 72.951 | $ 68.410 | $ 65.199 | $ 9.072 | $ 23.614 |
| 2004 | $ 85.520 | $ 72.618 | $ 67.215 | $ 62.784 | $ 7.947 | - |
| 2003 | $ 81.246 | $ 68.317 | $ 64.323 | $ 60.030 | $ 7.129 | $ 21.029 |
| 2002 | $ 77.726 | $ 65.855 | $ 61.984 | $ 58.366 | $ 6.438 | - |
| 2001 | $ 74.942 | $ 63.533 | $ 59.912 | $ 56.132 | $ 5.875 | $ 19.575 |
| 2000 | $ 72.565 | $ 60.999 | $ 57.030 | $ 54.384 | $ 5.497 | $ 18.979 |
| 1999 | $ 69.308 | $ 59.213 | $ 53.413 | $ 50.880 | $ 4.905 | $ 18.021 |
| 1998 | $ 66.325 | $ 57.678 | $ 51.755 | $ 49.931 | $ 4.535 | - |
| 1997 | $ 63.874 | $ 55.957 | $ 50.571 | $ 49.991 | $ 4.174 | - |
| 1996 | $ 61.528 | $ 54.498 | $ 48.673 | $ 49.102 | $ 3.791 | $ 16.447 |
| 1995 | $ 59.268 | $ 52.739 | $ 45.977 | $ 46.849 | $ 3.421 | - |
| 1994 | $ 57.664 | $ 51.028 | $ 43.945 | $ 44.910 | $ 3.044 | $ 15.137 |
| 1993 | $ 55.697 | $ 48.430 | $ 41.332 | $ 43.518 | $ 2.660 | - |
| 1992 | $ 53.869 | $ 46.959 | $ 38.779 | $ 42.835 | $ 2.300 | - |
| 1991 | $ 51.324 | $ 44.441 | $ 36.702 | $ 42.012 | $ 1.986 | - |
| 1990 | $ 49.420 | $ 41.933 | $ 35.179 | $ 39.961 | $ 1.796 | - |
Em 2025, o PIB por trabalhador (PPC) foi de 183.867 dólares nos Estados Unidos, 150.316 dólares na Alemanha, 133.311 dólares no Reino Unido, 100.933 dólares no Japão e 44.250 dólares na China (2022). O PIB por trabalhador dos Estados Unidos foi o maior das cinco em todos os anos desde 1990. A mudança mais recente nessa ordem foi em 1997, quando o PIB por trabalhador do Reino Unido superou o do Japão.
Comparar a produtividade do trabalho de 2 países quaisquer
Fontes:
- Banco Mundial | Economy & Growth (1990–2025, atualizado em outubro de 2026)
Creative Commons Atribuição (CC BY): você pode copiar, compartilhar, adaptar e reutilizar este conteúdo, inclusive para fins comerciais, desde que cite o statistics.wiki e indique as alterações que fizer. As fontes listadas acima podem ter suas próprias condições de licença.