
Portugal vs Cazaquistão: gráficos dos gastos com saúde por pessoa, US$ e $ PPC
1x
| Ano | US$ por pessoa | |
|---|---|---|
 Portugal |
 Cazaquistão |
|
| 2024 | US$ 2.971 | - |
| 2023 | US$ 2.762 | US$ 490 |
| 2022 | US$ 2.601 | US$ 422 |
| 2021 | US$ 2.764 | US$ 392 |
| 2020 | US$ 2.328 | US$ 330 |
| 2019 | US$ 2.210 | US$ 264 |
| 2018 | US$ 2.207 | US$ 267 |
| 2017 | US$ 1.991 | US$ 273 |
| 2016 | US$ 1.870 | US$ 256 |
| 2015 | US$ 1.787 | US$ 310 |
| 2014 | US$ 2.057 | US$ 370 |
| 2013 | US$ 2.027 | US$ 359 |
| 2012 | US$ 1.977 | US$ 365 |
| 2011 | US$ 2.256 | US$ 294 |
| 2010 | US$ 2.259 | US$ 241 |
| 2009 | US$ 2.347 | US$ 241 |
| 2008 | US$ 2.392 | US$ 246 |
| 2007 | US$ 2.113 | US$ 174 |
| 2006 | US$ 1.858 | US$ 171 |
| 2005 | US$ 1.814 | US$ 140 |
| 2004 | US$ 1.724 | US$ 108 |
| 2003 | US$ 1.443 | US$ 73 |
| 2002 | US$ 1.139 | US$ 57 |
| 2001 | US$ 1.016 | US$ 49 |
| 2000 | US$ 995 | US$ 49 |
1x
| Ano | $ PPC por pessoa | |
|---|---|---|
|
Portugal
|
Cazaquistão
|
|
| 2024 | $ 4.928 | - |
| 2023 | $ 4.679 | $ 1.460 |
| 2022 | $ 4.706 | $ 1.345 |
| 2021 | $ 4.324 | $ 1.293 |
| 2020 | $ 3.755 | $ 1.090 |
| 2019 | $ 3.584 | $ 800 |
| 2018 | $ 3.271 | $ 707 |
| 2017 | $ 3.062 | $ 732 |
| 2016 | $ 2.957 | $ 788 |
| 2015 | $ 2.754 | $ 684 |
| 2014 | $ 2.674 | $ 713 |
| 2013 | $ 2.616 | $ 633 |
| 2012 | $ 2.542 | $ 649 |
| 2011 | $ 2.601 | $ 525 |
| 2010 | $ 2.734 | $ 510 |
| 2009 | $ 2.682 | $ 604 |
| 2008 | $ 2.557 | $ 523 |
| 2007 | $ 2.384 | $ 448 |
| 2006 | $ 2.311 | $ 509 |
| 2005 | $ 2.195 | $ 516 |
| 2004 | $ 2.050 | $ 469 |
| 2003 | $ 1.905 | $ 392 |
| 2002 | $ 1.793 | $ 344 |
| 2001 | $ 1.690 | $ 297 |
| 2000 | $ 1.630 | $ 309 |
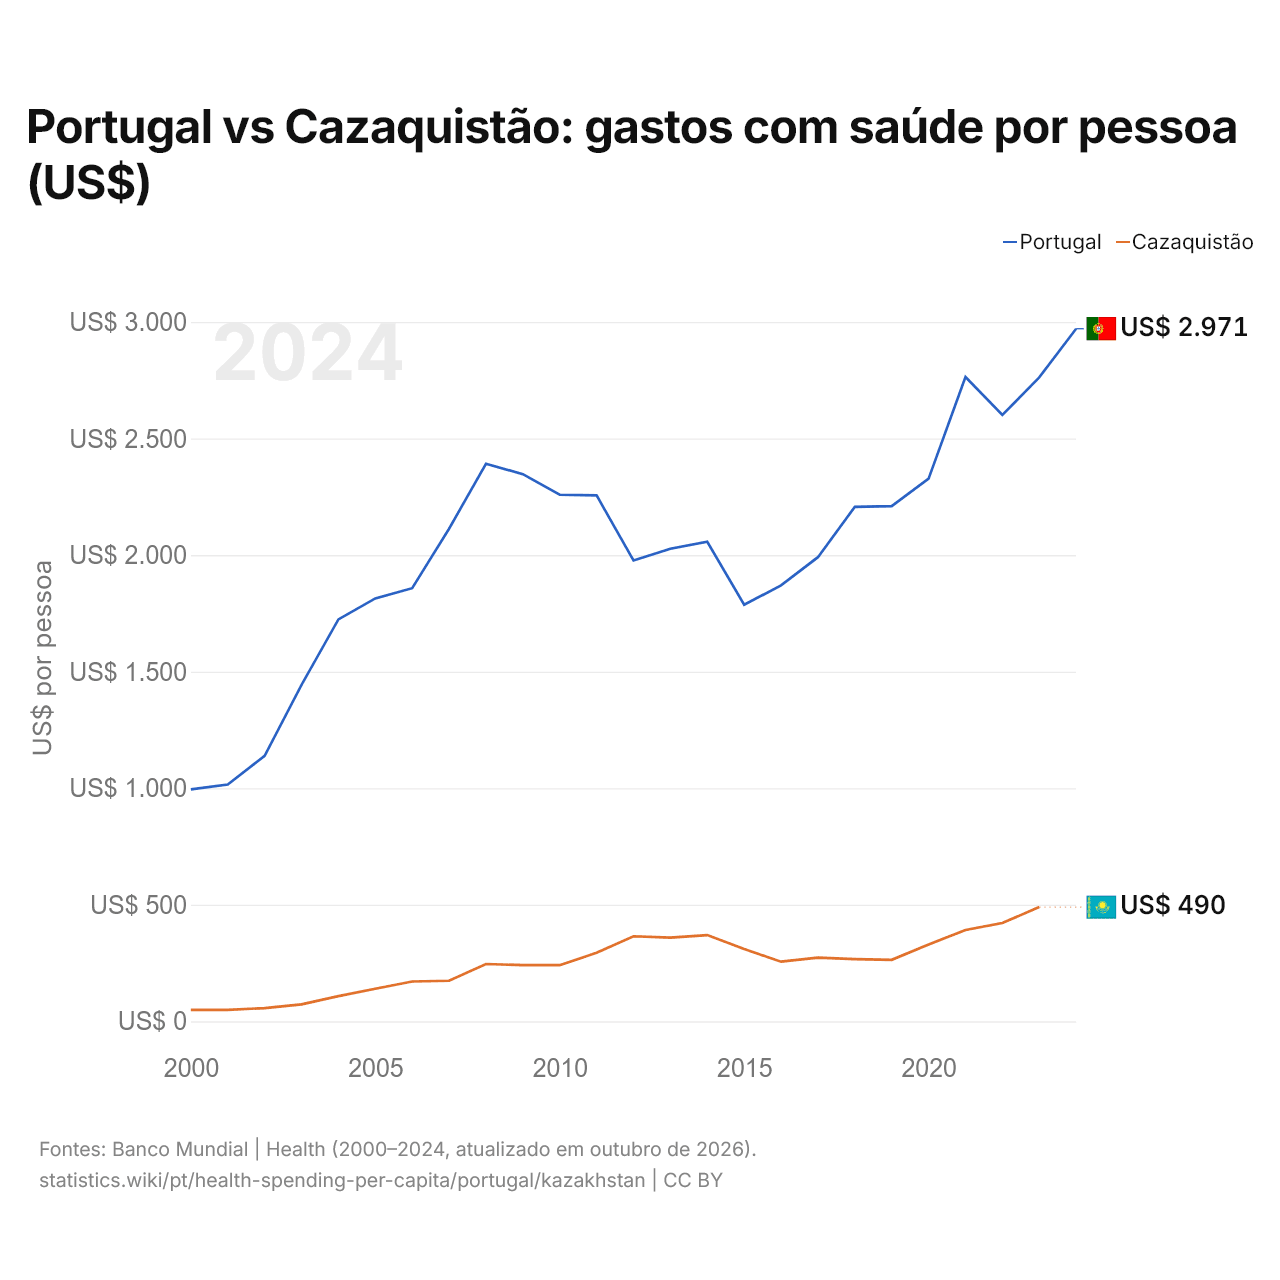
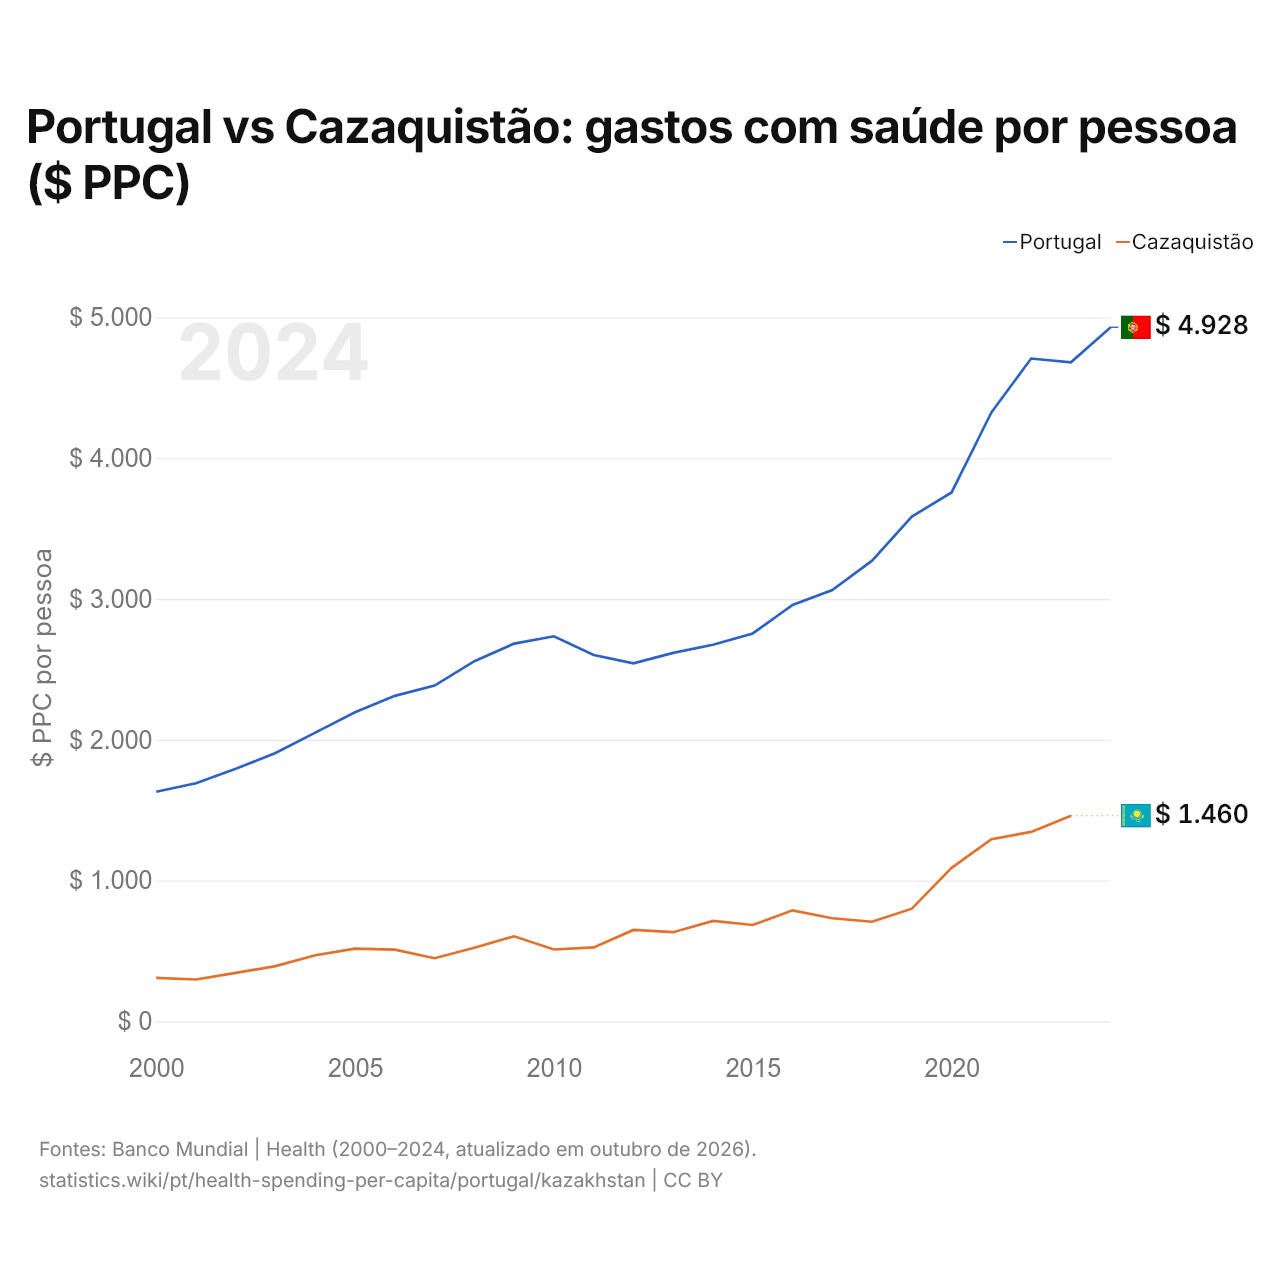
Os gastos com saúde por pessoa foram de US$ 2.762 em Portugal e de US$ 490 no Cazaquistão: 5,6 vezes mais em Portugal. Em 2000, foram de US$ 995 em Portugal e de US$ 49 no Cazaquistão. Em paridade do poder de compra, foram de 4.679 $ PPC em Portugal e de 1.460 $ PPC no Cazaquistão.
Os gastos com saúde por pessoa em US$ de Portugal têm sido maiores que os do Cazaquistão todos os anos desde 2000.
Portugal vs Cazaquistão: gastos com saúde por pessoa mais recentes e quem paga (% dos gastos correntes com saúde)
|
Portugal
|
Cazaquistão
|
|
|---|---|---|
| US$ por pessoa | US$ 2.971 (2024) | US$ 490 (2023) |
| $ PPC por pessoa | 4.928 $ PPC (2024) | 1.460 $ PPC (2023) |
| Posição mundial | 31/192 | 93/192 |
| Governo | 61,4% (2023) | 65,8% (2023) |
| Pagamento direto | 28,2% (2024) | 27,6% (2023) |
| Outros privados | 9,2% (2023) | 6,3% (2023) |
| Ajuda externa | 0,1% (2023) | 0,2% (2023) |
Comparar os gastos com saúde per capita de dois países
Fontes:
- Banco Mundial | Health (2000–2024, atualizado em outubro de 2026)
Creative Commons Atribuição (CC BY): você pode copiar, compartilhar, adaptar e reutilizar este conteúdo, inclusive para fins comerciais, desde que cite o statistics.wiki e indique as alterações que fizer. As fontes listadas acima podem ter suas próprias condições de licença.