
Omã vs Kuwait: gráficos dos gastos com saúde por pessoa, US$ e $ PPC
1x
| Ano | US$ por pessoa | |
|---|---|---|
 Omã |
 Kuwait |
|
| 2023 | US$ 732 | US$ 1.679 |
| 2022 | US$ 712 | US$ 1.683 |
| 2021 | US$ 843 | US$ 1.829 |
| 2020 | US$ 859 | US$ 1.543 |
| 2019 | US$ 730 | US$ 1.643 |
| 2018 | US$ 640 | US$ 1.659 |
| 2017 | US$ 705 | US$ 1.352 |
| 2016 | US$ 714 | US$ 1.293 |
| 2015 | US$ 767 | US$ 1.260 |
| 2014 | US$ 727 | US$ 1.294 |
| 2013 | US$ 588 | US$ 1.235 |
| 2012 | US$ 561 | US$ 1.217 |
| 2011 | US$ 563 | US$ 1.147 |
| 2010 | US$ 584 | US$ 1.050 |
| 2009 | US$ 510 | US$ 1.026 |
| 2008 | US$ 467 | US$ 1.069 |
| 2007 | US$ 397 | US$ 881 |
| 2006 | US$ 342 | US$ 782 |
| 2005 | US$ 327 | US$ 727 |
| 2004 | US$ 306 | US$ 649 |
| 2003 | US$ 290 | US$ 626 |
| 2002 | US$ 274 | US$ 578 |
| 2001 | US$ 260 | US$ 554 |
| 2000 | US$ 262 | US$ 425 |
1x
| Ano | $ PPC por pessoa | |
|---|---|---|
|
Omã
|
Kuwait
|
|
| 2023 | $ 1.444 | $ 2.567 |
| 2022 | $ 1.301 | $ 2.294 |
| 2021 | $ 1.682 | $ 2.718 |
| 2020 | $ 1.800 | $ 2.535 |
| 2019 | $ 1.418 | $ 2.628 |
| 2018 | $ 1.215 | $ 2.657 |
| 2017 | $ 1.329 | $ 2.167 |
| 2016 | $ 1.392 | $ 1.981 |
| 2015 | $ 1.471 | $ 1.908 |
| 2014 | $ 1.388 | $ 1.993 |
| 2013 | $ 1.178 | $ 1.911 |
| 2012 | $ 1.138 | $ 1.915 |
| 2011 | $ 1.172 | $ 1.844 |
| 2010 | $ 1.378 | $ 2.014 |
| 2009 | $ 1.361 | $ 2.168 |
| 2008 | $ 928 | $ 1.738 |
| 2007 | $ 1.028 | $ 1.762 |
| 2006 | $ 931 | $ 1.622 |
| 2005 | $ 989 | $ 1.711 |
| 2004 | $ 1.094 | $ 1.820 |
| 2003 | $ 1.136 | $ 1.925 |
| 2002 | $ 1.153 | $ 1.866 |
| 2001 | $ 1.126 | $ 1.866 |
| 2000 | $ 1.059 | $ 1.294 |
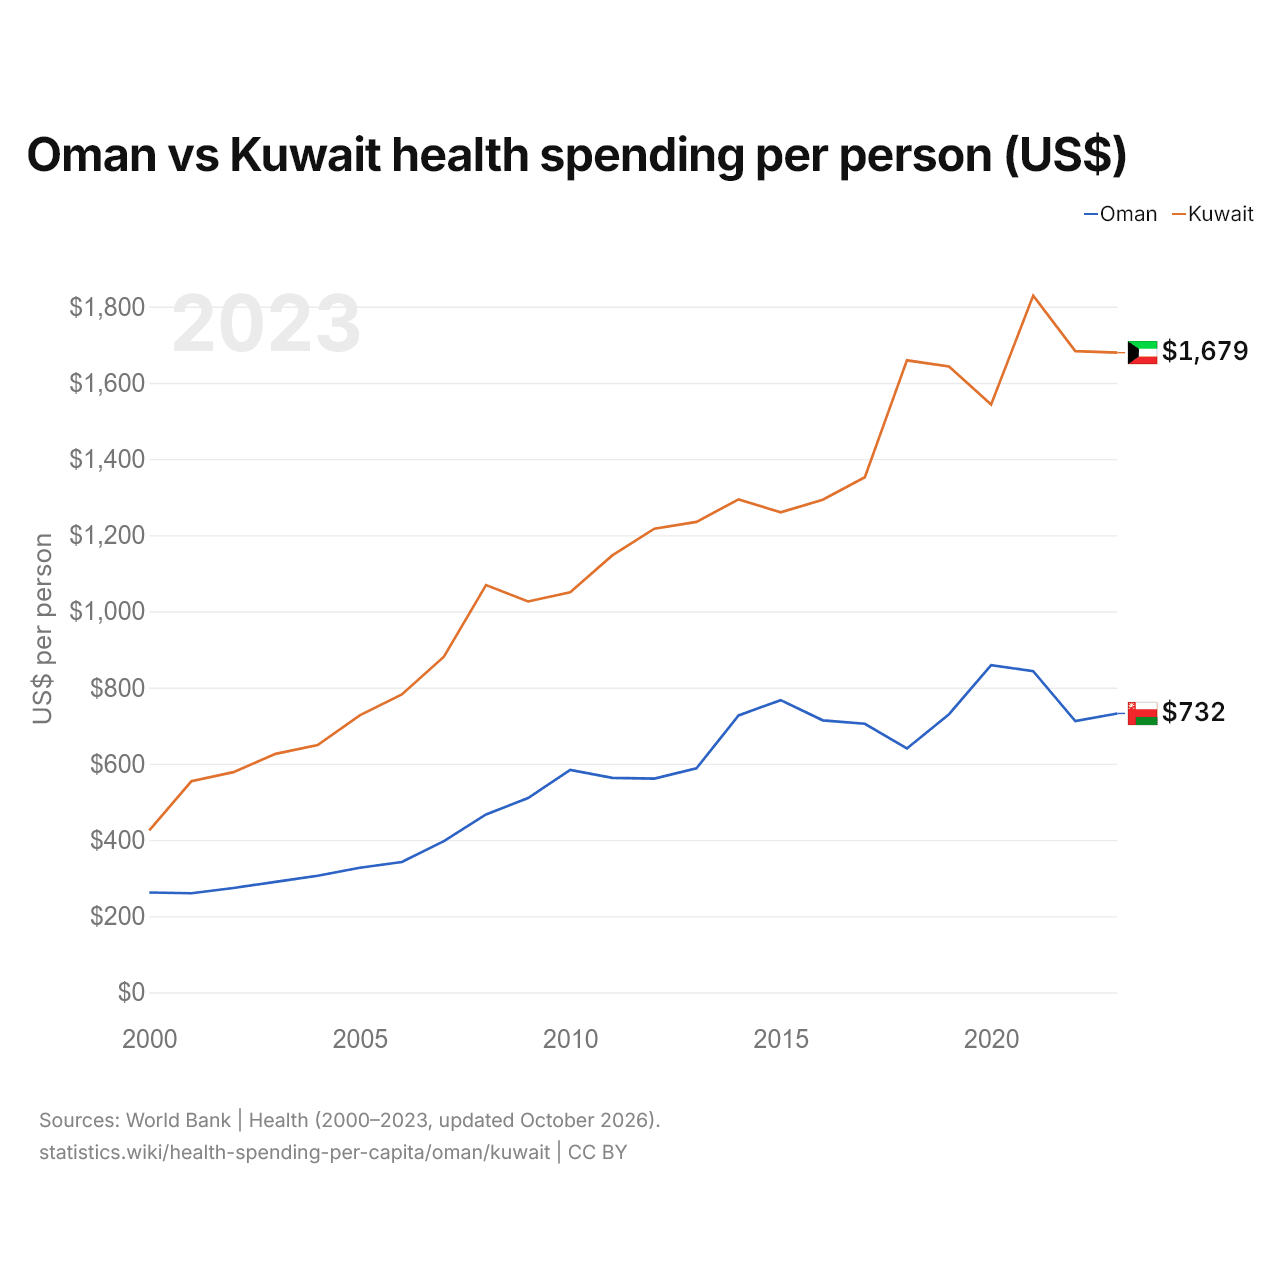
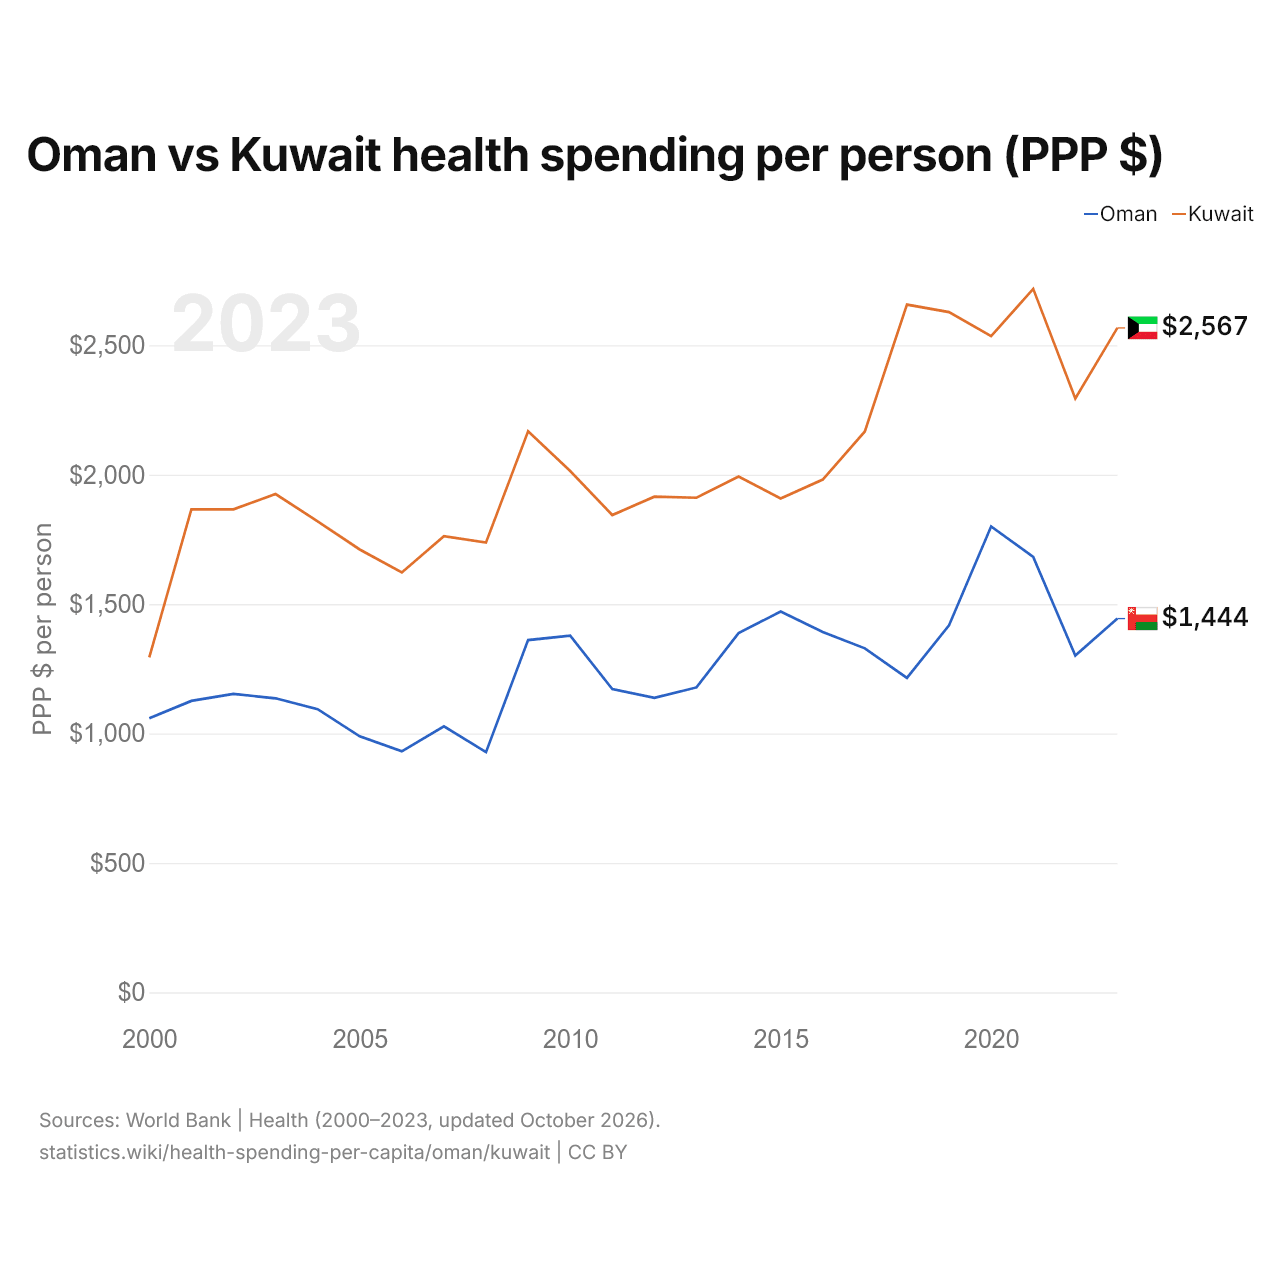
Os gastos com saúde por pessoa são de US$ 732 em Omã e de US$ 1.679 no Kuwait: 2,3 vezes mais no Kuwait. Em 2000, foram de US$ 262 em Omã e de US$ 425 no Kuwait. Em paridade do poder de compra, são de 1.444 $ PPC em Omã e de 2.567 $ PPC no Kuwait.
Os gastos com saúde por pessoa em US$ do Kuwait têm sido maiores que os de Omã todos os anos desde 2000.
Omã vs Kuwait: gastos com saúde por pessoa mais recentes e quem paga (% dos gastos correntes com saúde)
|
Omã
|
Kuwait
|
|
|---|---|---|
| US$ por pessoa | US$ 732 (2023) | US$ 1.679 (2023) |
| $ PPC por pessoa | 1.444 $ PPC (2023) | 2.567 $ PPC (2023) |
| Posição mundial | 75/192 | 48/192 |
| Governo | 85,3% (2023) | 88,5% (2023) |
| Pagamento direto | 6,3% (2023) | 10,0% (2023) |
| Outros privados | 8,3% (2023) | 1,4% (2023) |
Comparar os gastos com saúde per capita de dois países
Fontes:
- Banco Mundial | Health (2000–2023, atualizado em outubro de 2026)
Creative Commons Atribuição (CC BY): você pode copiar, compartilhar, adaptar e reutilizar este conteúdo, inclusive para fins comerciais, desde que cite o statistics.wiki e indique as alterações que fizer. As fontes listadas acima podem ter suas próprias condições de licença.