
Senegal vs Marrocos: RNB per capita, 1968–2025
| Ano | Método Atlas, US$ correntes | |
|---|---|---|
 Senegal |
 Marrocos |
|
| 2025 | US$ 1.780 | US$ 4.430 |
| 2024 | US$ 1.630 | US$ 3.900 |
| 2023 | US$ 1.620 | US$ 3.840 |
| 2022 | US$ 1.590 | US$ 3.760 |
| 2021 | US$ 1.540 | US$ 3.690 |
| 2020 | US$ 1.430 | US$ 3.310 |
| 2019 | US$ 1.430 | US$ 3.560 |
| 2018 | US$ 1.390 | US$ 3.430 |
| 2017 | US$ 1.270 | US$ 3.210 |
| 2016 | US$ 1.270 | US$ 3.190 |
| 2015 | US$ 1.320 | US$ 3.350 |
| 2014 | US$ 1.370 | US$ 3.370 |
| 2013 | US$ 1.350 | US$ 3.400 |
| 2012 | US$ 1.320 | US$ 3.280 |
| 2011 | US$ 1.310 | US$ 3.300 |
| 2010 | US$ 1.340 | US$ 3.230 |
| 2009 | US$ 1.330 | US$ 3.190 |
| 2008 | US$ 1.240 | US$ 3.000 |
| 2007 | US$ 1.090 | US$ 2.660 |
| 2006 | US$ 1.020 | US$ 2.520 |
| 2005 | US$ 980 | US$ 2.330 |
| 2004 | US$ 850 | US$ 2.080 |
| 2003 | US$ 710 | US$ 1.760 |
| 2002 | US$ 610 | US$ 1.560 |
| 2001 | US$ 640 | US$ 1.590 |
| 2000 | US$ 650 | US$ 1.590 |
| 1999 | US$ 670 | US$ 1.560 |
| 1998 | US$ 680 | US$ 1.550 |
| 1997 | US$ 700 | US$ 1.500 |
| 1996 | US$ 690 | US$ 1.560 |
| 1995 | US$ 720 | US$ 1.340 |
| 1994 | US$ 760 | US$ 1.390 |
| 1993 | US$ 910 | US$ 1.260 |
| 1992 | US$ 960 | US$ 1.310 |
| 1991 | US$ 910 | US$ 1.270 |
| 1990 | US$ 900 | US$ 1.190 |
| 1989 | US$ 920 | US$ 1.140 |
| 1988 | US$ 920 | US$ 1.110 |
| 1987 | US$ 800 | US$ 880 |
| 1986 | US$ 620 | US$ 790 |
| 1985 | US$ 540 | US$ 700 |
| 1984 | US$ 540 | US$ 750 |
| 1983 | US$ 580 | US$ 810 |
| 1982 | US$ 740 | US$ 970 |
| 1981 | US$ 800 | US$ 990 |
| 1980 | US$ 800 | US$ 1.010 |
| 1979 | US$ 680 | US$ 810 |
| 1978 | US$ 560 | US$ 670 |
| 1977 | US$ 560 | US$ 620 |
| 1976 | US$ 570 | US$ 600 |
| 1975 | US$ 530 | US$ 560 |
| 1974 | US$ 430 | US$ 460 |
| 1973 | US$ 360 | US$ 370 |
| 1972 | US$ 330 | US$ 310 |
| 1971 | US$ 300 | US$ 280 |
| 1970 | US$ 310 | US$ 270 |
| 1969 | US$ 300 | US$ 250 |
| 1968 | US$ 320 | US$ 240 |
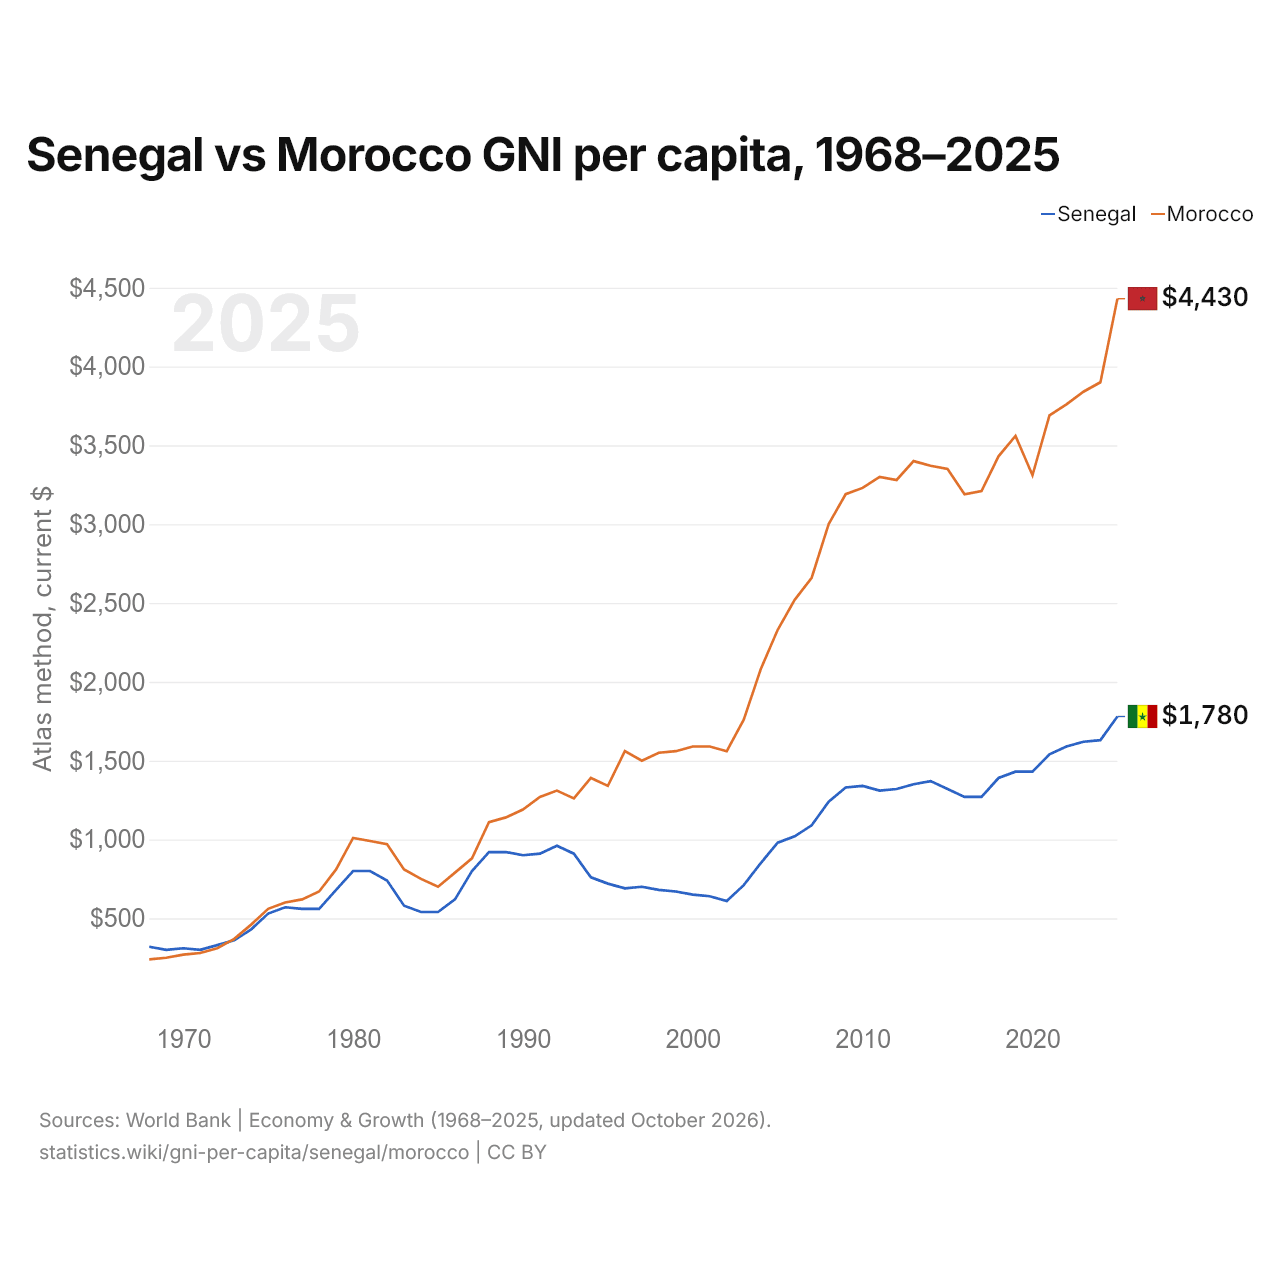
Em 2025, a RNB per capita pelo método Atlas foi de US$ 1.780 no Senegal e de US$ 4.430 no Marrocos: 2,5 vezes maior no Marrocos. Em 1968, era de US$ 320 no Senegal e de US$ 240 no Marrocos, 33% maior no Senegal.
A RNB per capita do Marrocos tem sido mais alta que a do Senegal todos os anos desde 1973. Convertida pela paridade do poder de compra, a RNB per capita foi de 5.100 dólares no Senegal e de 10.960 dólares no Marrocos em 2025: 2,1 vezes maior no Marrocos.
Senegal vs Marrocos: dados mais recentes da RNB per capita
Comparar a RNB per capita de 2 países quaisquer
Fontes:
- Banco Mundial | Economy & Growth (1968–2025, atualizado em outubro de 2026)
Creative Commons Atribuição (CC BY): você pode copiar, compartilhar, adaptar e reutilizar este conteúdo, inclusive para fins comerciais, desde que cite o statistics.wiki e indique as alterações que fizer. As fontes listadas acima podem ter suas próprias condições de licença.