
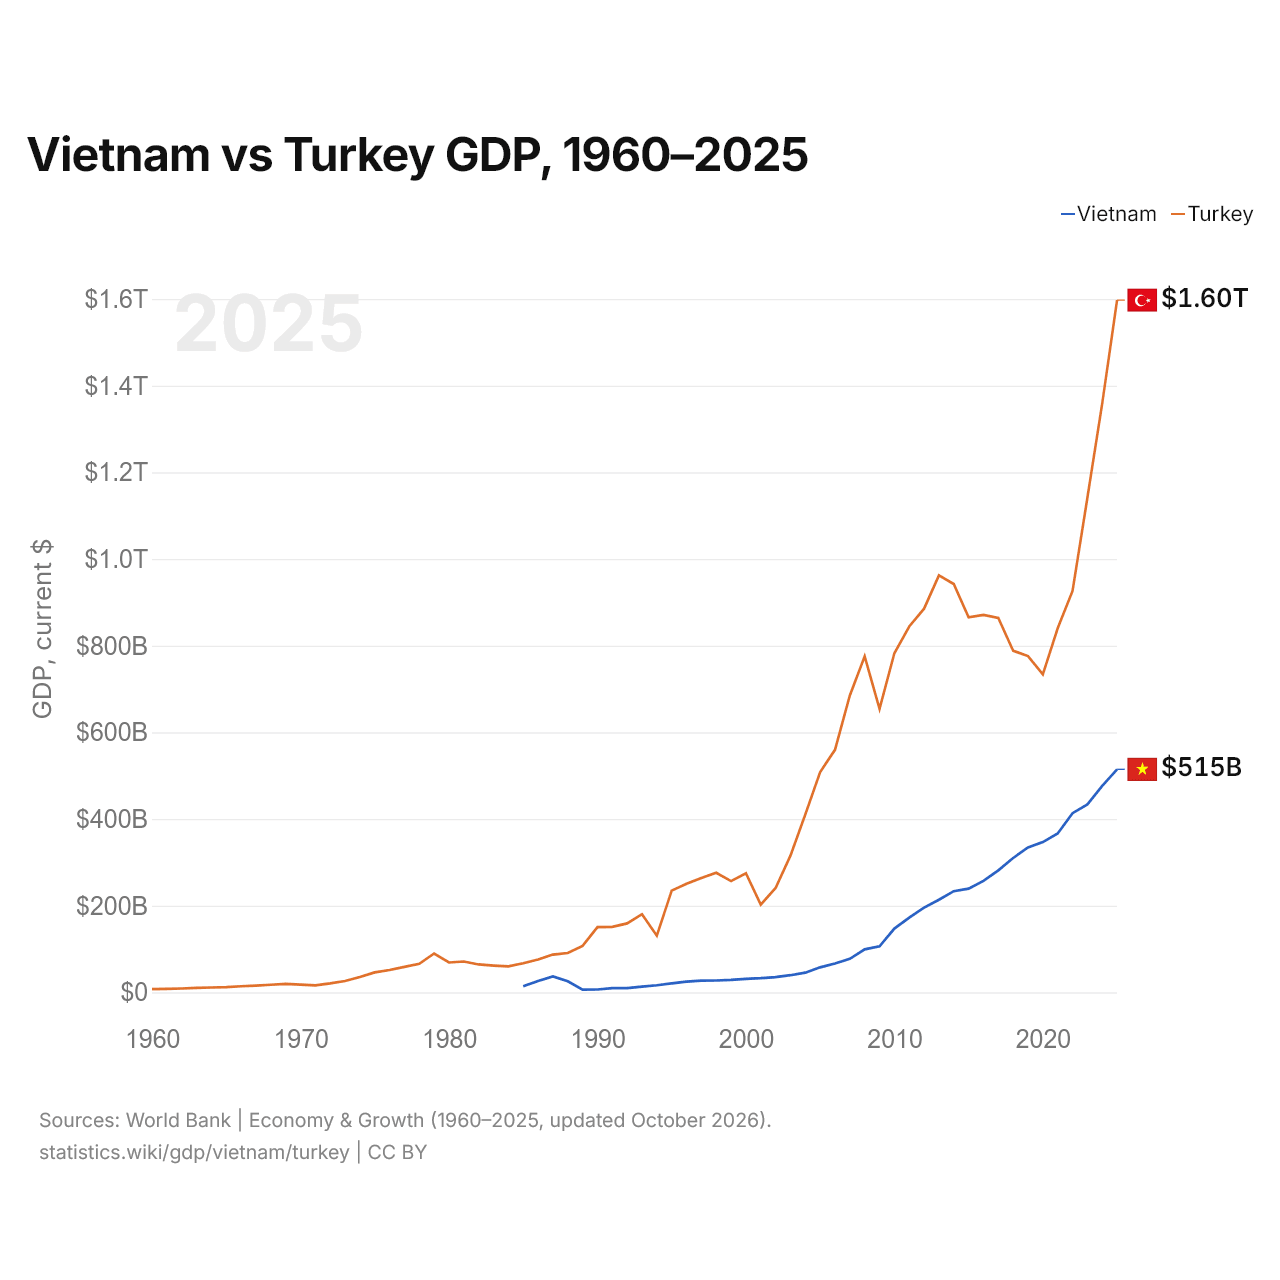
Vietnã vs Turquia: PIB, 1960–2025
1x
| Ano | PIB, US$ correntes | |
|---|---|---|
 Vietnã |
 Turquia |
|
| 2025 | US$ 514.697.215.165 | US$ 1.597.293.229.287 |
| 2024 | US$ 476.324.572.784 | US$ 1.359.123.768.774 |
| 2023 | US$ 433.805.036.898 | US$ 1.141.242.864.657 |
| 2022 | US$ 413.445.230.669 | US$ 926.097.476.914 |
| 2021 | US$ 366.474.752.771 | US$ 839.938.668.172 |
| 2020 | US$ 346.615.738.538 | US$ 733.628.247.119 |
| 2019 | US$ 334.365.270.497 | US$ 775.853.144.223 |
| 2018 | US$ 310.106.478.395 | US$ 788.356.985.774 |
| 2017 | US$ 281.353.605.987 | US$ 863.874.522.365 |
| 2016 | US$ 257.096.001.178 | US$ 870.818.016.910 |
| 2015 | US$ 239.258.328.382 | US$ 865.460.050.684 |
| 2014 | US$ 233.451.469.643 | US$ 942.343.431.929 |
| 2013 | US$ 213.708.811.665 | US$ 962.167.643.589 |
| 2012 | US$ 195.590.661.129 | US$ 885.327.622.479 |
| 2011 | US$ 172.595.049.184 | US$ 844.192.507.381 |
| 2010 | US$ 147.201.173.197 | US$ 782.545.664.268 |
| 2009 | US$ 106.014.659.565 | US$ 653.894.449.921 |
| 2008 | US$ 99.130.304.099 | US$ 775.415.944.333 |
| 2007 | US$ 77.414.425.532 | US$ 685.228.481.017 |
| 2006 | US$ 66.371.664.817 | US$ 559.668.118.237 |
| 2005 | US$ 57.633.255.738 | US$ 508.314.210.213 |
| 2004 | US$ 45.427.854.693 | US$ 410.156.784.496 |
| 2003 | US$ 39.552.513.232 | US$ 315.392.899.922 |
| 2002 | US$ 35.064.105.501 | US$ 240.778.008.474 |
| 2001 | US$ 32.685.198.809 | US$ 202.195.080.239 |
| 2000 | US$ 31.172.518.403 | US$ 274.748.463.179 |
| 1999 | US$ 28.683.659.007 | US$ 256.673.939.248 |
| 1998 | US$ 27.209.602.050 | US$ 276.035.372.655 |
| 1997 | US$ 26.843.700.442 | US$ 263.817.553.748 |
| 1996 | US$ 24.657.470.575 | US$ 250.366.965.174 |
| 1995 | US$ 20.736.164.459 | US$ 234.699.627.004 |
| 1994 | US$ 16.286.433.533 | US$ 130.650.447.499 |
| 1993 | US$ 13.180.953.598 | US$ 180.415.757.852 |
| 1992 | US$ 9.866.990.236 | US$ 159.104.772.992 |
| 1991 | US$ 9.613.369.520 | US$ 151.034.731.544 |
| 1990 | US$ 6.471.740.806 | US$ 150.655.500.192 |
| 1989 | US$ 6.293.304.975 | US$ 107.127.191.329 |
| 1988 | US$ 25.423.812.649 | US$ 90.875.175.809 |
| 1987 | US$ 36.658.108.850 | US$ 87.190.081.680 |
| 1986 | US$ 26.336.616.250 | US$ 75.673.037.037 |
| 1985 | US$ 14.094.687.821 | US$ 67.232.758.621 |
| 1984 | - | US$ 59.937.602.180 |
| 1983 | - | US$ 61.803.555.556 |
| 1982 | - | US$ 64.369.325.153 |
| 1981 | - | US$ 71.180.180.180 |
| 1980 | - | US$ 68.823.684.211 |
| 1979 | - | US$ 89.616.129.032 |
| 1978 | - | US$ 65.912.500.000 |
| 1977 | - | US$ 58.683.333.333 |
| 1976 | - | US$ 51.450.000.000 |
| 1975 | - | US$ 46.042.857.143 |
| 1974 | - | US$ 35.414.285.714 |
| 1973 | - | US$ 26.000.000.000 |
| 1972 | - | US$ 20.650.000.000 |
| 1971 | - | US$ 16.166.666.667 |
| 1970 | - | US$ 17.863.636.364 |
| 1969 | - | US$ 19.466.666.667 |
| 1968 | - | US$ 17.500.000.000 |
| 1967 | - | US$ 15.644.444.444 |
| 1966 | - | US$ 14.100.000.000 |
| 1965 | - | US$ 11.966.666.667 |
| 1964 | - | US$ 11.177.777.778 |
| 1963 | - | US$ 10.355.555.556 |
| 1962 | - | US$ 8.922.222.222 |
| 1961 | - | US$ 7.988.888.889 |
| 1960 | - | US$ 7.566.666.667 |
Em 2025, o PIB da Turquia (US$ 1,6 trilhão) foi 3,1 vezes o do Vietnã (US$ 515 bilhões). Em 2015, era 3,6 vezes. De 2015 a 2025, a preços constantes de 2015, o PIB da Turquia cresceu 57,6% e o do Vietnã, 82,9%.
Desde 1985, o PIB da Turquia foi o maior dos dois todos os anos; em 1985, era 4,8 vezes o do Vietnã. Em 2025, o PIB per capita foi de US$ 5.066 no Vietnã e de US$ 18.599 na Turquia, 3,7 vezes maior na Turquia.
Vietnã vs Turquia: dados mais recentes do PIB
|
Vietnã
|
Turquia
|
|
|---|---|---|
| PIB, US$ correntes | US$ 515 bi | US$ 1,60 tri |
| Posição mundial | 33/197 | 16/197 |
| Participação mundial | 0,43% | 1,35% |
| PIB, US$ constantes de 2015 | US$ 438 bi | US$ 1,36 tri |
| Diferença de PIB | 0,32× | 3,1× |
Comparar o PIB de 2 países quaisquer
Fontes:
- Banco Mundial | Economy & Growth (1960–2025, atualizado em outubro de 2026)
Creative Commons Atribuição (CC BY): você pode copiar, compartilhar, adaptar e reutilizar este conteúdo, inclusive para fins comerciais, desde que cite o statistics.wiki e indique as alterações que fizer. As fontes listadas acima podem ter suas próprias condições de licença.