
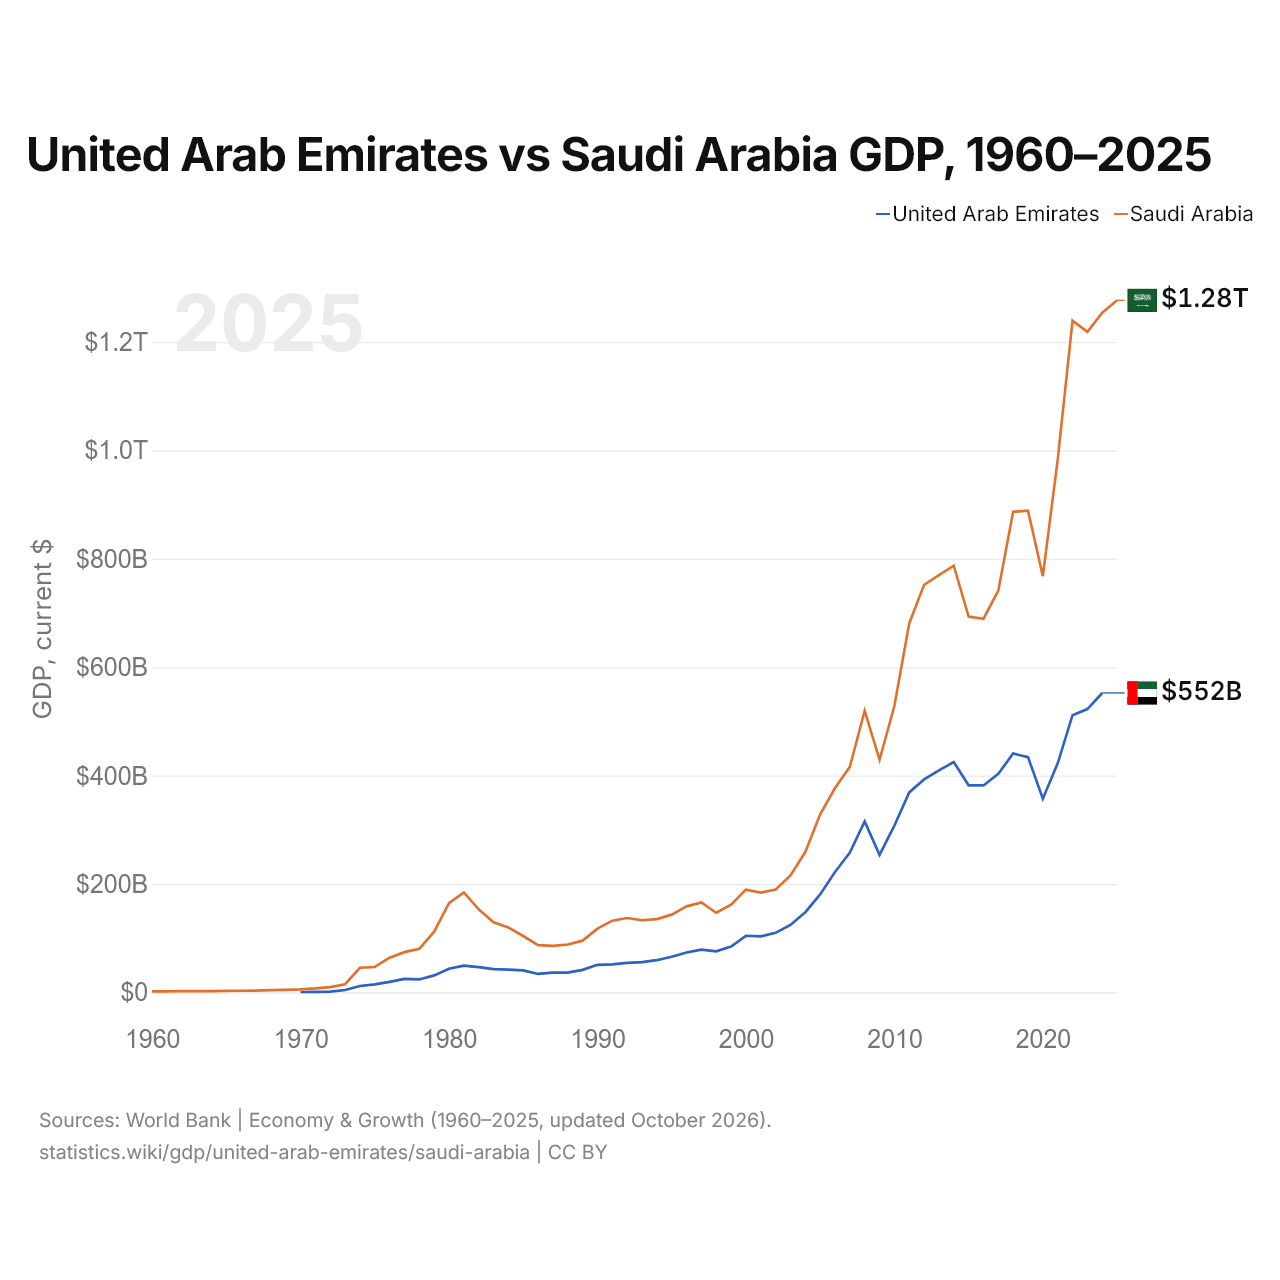
Emirados Árabes Unidos vs Arábia Saudita: PIB, 1960–2025
| Ano | PIB, US$ correntes | |
|---|---|---|
 EAU |
 Arábia Saudita |
|
| 2025 | - | US$ 1.276.942.933.333 |
| 2024 | US$ 552.324.919.096 | US$ 1.254.140.800.000 |
| 2023 | US$ 522.622.268.401 | US$ 1.218.584.800.000 |
| 2022 | US$ 511.403.404.642 | US$ 1.239.075.200.000 |
| 2021 | US$ 422.441.282.436 | US$ 982.661.066.667 |
| 2020 | US$ 357.161.776.271 | US$ 767.951.200.000 |
| 2019 | US$ 433.926.218.686 | US$ 888.890.133.333 |
| 2018 | US$ 440.560.003.161 | US$ 886.564.800.000 |
| 2017 | US$ 403.365.056.079 | US$ 741.266.133.333 |
| 2016 | US$ 381.717.208.621 | US$ 689.279.466.667 |
| 2015 | US$ 381.973.135.513 | US$ 693.414.400.000 |
| 2014 | US$ 424.935.834.104 | US$ 787.153.066.667 |
| 2013 | US$ 409.632.574.703 | US$ 769.755.733.333 |
| 2012 | US$ 392.793.559.051 | US$ 751.921.333.333 |
| 2011 | US$ 368.881.033.963 | US$ 680.660.800.000 |
| 2010 | US$ 307.736.348.527 | US$ 528.207.466.667 |
| 2009 | US$ 253.547.358.747 | US$ 429.097.866.667 |
| 2008 | US$ 315.474.615.741 | US$ 519.796.800.000 |
| 2007 | US$ 257.916.148.767 | US$ 415.964.509.673 |
| 2006 | US$ 222.116.532.963 | US$ 376.900.133.511 |
| 2005 | US$ 180.617.467.954 | US$ 328.459.608.764 |
| 2004 | US$ 147.824.249.958 | US$ 258.742.133.333 |
| 2003 | US$ 124.346.476.180 | US$ 215.807.733.333 |
| 2002 | US$ 109.816.091.079 | US$ 189.605.866.667 |
| 2001 | US$ 103.311.631.797 | US$ 184.137.600.000 |
| 2000 | US$ 104.337.463.730 | US$ 189.514.933.333 |
| 1999 | US$ 84.445.399.335 | US$ 161.717.066.667 |
| 1998 | US$ 75.674.384.205 | US$ 146.775.466.667 |
| 1997 | US$ 78.838.886.862 | US$ 165.963.684.913 |
| 1996 | US$ 73.571.217.377 | US$ 158.662.483.311 |
| 1995 | US$ 65.743.604.966 | US$ 143.343.124.166 |
| 1994 | US$ 59.305.111.228 | US$ 135.174.899.866 |
| 1993 | US$ 55.625.269.485 | US$ 132.967.957.276 |
| 1992 | US$ 54.239.188.746 | US$ 137.087.850.467 |
| 1991 | US$ 51.552.058.250 | US$ 132.223.230.975 |
| 1990 | US$ 50.701.374.187 | US$ 117.630.173.565 |
| 1989 | US$ 41.464.966.302 | US$ 95.344.459.279 |
| 1988 | US$ 36.275.613.877 | US$ 88.256.074.766 |
| 1987 | US$ 36.384.802.310 | US$ 85.695.861.148 |
| 1986 | US$ 33.943.568.481 | US$ 86.961.922.765 |
| 1985 | US$ 40.603.631.079 | US$ 103.897.846.494 |
| 1984 | US$ 41.807.931.453 | US$ 119.624.858.116 |
| 1983 | US$ 42.803.373.390 | US$ 129.171.635.311 |
| 1982 | US$ 46.622.715.281 | US$ 153.240.313.858 |
| 1981 | US$ 49.333.471.895 | US$ 184.291.360.139 |
| 1980 | US$ 43.599.134.193 | US$ 164.539.660.725 |
| 1979 | US$ 31.225.557.022 | US$ 111.858.444.786 |
| 1978 | US$ 23.775.718.541 | US$ 80.266.516.687 |
| 1977 | US$ 24.871.660.292 | US$ 74.188.986.586 |
| 1976 | US$ 19.213.212.475 | US$ 64.005.665.722 |
| 1975 | US$ 14.720.729.969 | US$ 46.773.208.643 |
| 1974 | US$ 11.651.505.689 | US$ 45.412.957.746 |
| 1973 | US$ 4.231.243.616 | US$ 14.947.435.499 |
| 1972 | US$ 1.415.086.929 | US$ 9.664.267.087 |
| 1971 | US$ 939.893.600 | US$ 7.184.806.909 |
| 1970 | US$ 685.986.701 | US$ 5.377.333.333 |
| 1969 | - | US$ 4.485.777.644 |
| 1968 | - | US$ 4.187.777.711 |
| 1967 | - | US$ 3.257.022.223 |
| 1966 | - | US$ 2.920.555.557 |
| 1965 | - | US$ 2.647.955.558 |
| 1964 | - | US$ 2.371.808.713 |
| 1963 | - | US$ 2.207.393.172 |
| 1962 | - | US$ 2.130.606.532 |
| 1961 | - | US$ 1.920.811.284 |
| 1960 | - | US$ 1.748.124.064 |
O PIB da Arábia Saudita (US$ 1,25 trilhão, 2024) foi 2,3 vezes o dos Emirados Árabes Unidos (US$ 552 bilhões, 2024). Em 2014, era 1,9 vezes. Desde 2014, a preços constantes de 2015, o PIB da Arábia Saudita cresceu 33,8% e o dos Emirados Árabes Unidos, 28,1%.
Desde 1970, o PIB da Arábia Saudita foi o maior dos dois todos os anos; em 1970, era 7,8 vezes o dos Emirados Árabes Unidos. O PIB per capita é de US$ 50.274 nos Emirados Árabes Unidos (2024) e de US$ 34.537 na Arábia Saudita (2025).
Emirados Árabes Unidos vs Arábia Saudita: dados mais recentes do PIB
|
EAU
|
Arábia Saudita
|
|
|---|---|---|
| PIB, US$ correntes | US$ 552 bi (2024) | US$ 1,28 tri (2025) |
| Posição mundial | 31/197 | 19/197 |
| Participação mundial | 0,49% | 1,08% |
| PIB, US$ constantes de 2015 | US$ 457 bi (2024) | US$ 927 bi (2025) |
Comparar o PIB de 2 países quaisquer
Fontes:
- Banco Mundial | Economy & Growth (1960–2025, atualizado em outubro de 2026)
Creative Commons Atribuição (CC BY): você pode copiar, compartilhar, adaptar e reutilizar este conteúdo, inclusive para fins comerciais, desde que cite o statistics.wiki e indique as alterações que fizer. As fontes listadas acima podem ter suas próprias condições de licença.