
Filipinas vs México: PIB, 1960–2025
1x
| Ano | PIB, US$ correntes | |
|---|---|---|
 Filipinas |
 México |
|
| 2025 | US$ 487.086.123.720 | US$ 1.832.641.364.776 |
| 2024 | US$ 461.671.157.905 | US$ 1.830.489.311.089 |
| 2023 | US$ 437.055.627.245 | US$ 1.794.410.347.718 |
| 2022 | US$ 404.353.369.605 | US$ 1.466.934.724.243 |
| 2021 | US$ 394.087.359.848 | US$ 1.316.569.466.834 |
| 2020 | US$ 361.751.145.452 | US$ 1.121.064.767.169 |
| 2019 | US$ 376.823.402.239 | US$ 1.304.106.204.006 |
| 2018 | US$ 346.841.896.587 | US$ 1.256.300.182.984 |
| 2017 | US$ 328.480.736.803 | US$ 1.190.721.475.853 |
| 2016 | US$ 318.627.003.017 | US$ 1.112.233.497.453 |
| 2015 | US$ 306.445.871.242 | US$ 1.213.294.467.654 |
| 2014 | US$ 297.483.555.338 | US$ 1.364.507.717.689 |
| 2013 | US$ 283.902.828.589 | US$ 1.327.436.290.439 |
| 2012 | US$ 261.920.540.963 | US$ 1.255.110.424.742 |
| 2011 | US$ 234.216.730.291 | US$ 1.229.013.703.417 |
| 2010 | US$ 208.368.893.151 | US$ 1.105.424.238.652 |
| 2009 | US$ 175.974.755.881 | US$ 943.437.414.951 |
| 2008 | US$ 181.624.626.327 | US$ 1.161.553.459.985 |
| 2007 | US$ 155.980.408.673 | US$ 1.102.355.554.880 |
| 2006 | US$ 127.652.926.368 | US$ 1.020.265.057.882 |
| 2005 | US$ 107.419.977.318 | US$ 917.571.853.437 |
| 2004 | US$ 95.001.999.685 | US$ 819.459.227.375 |
| 2003 | US$ 87.039.092.974 | US$ 765.549.967.889 |
| 2002 | US$ 84.307.345.888 | US$ 810.666.116.402 |
| 2001 | US$ 78.921.234.458 | US$ 796.064.590.549 |
| 2000 | US$ 83.669.788.377 | US$ 742.061.329.749 |
| 1999 | US$ 85.640.171.045 | US$ 631.249.359.702 |
| 1998 | US$ 74.492.416.330 | US$ 557.461.102.631 |
| 1997 | US$ 94.106.317.565 | US$ 523.449.530.464 |
| 1996 | US$ 94.648.084.429 | US$ 432.157.945.024 |
| 1995 | US$ 84.644.328.727 | US$ 380.157.469.867 |
| 1994 | US$ 73.159.336.915 | US$ 553.618.247.901 |
| 1993 | US$ 62.036.529.147 | US$ 530.160.763.663 |
| 1992 | US$ 60.422.328.242 | US$ 363.157.832.924 |
| 1991 | US$ 51.784.144.943 | US$ 313.139.656.146 |
| 1990 | US$ 50.508.286.642 | US$ 261.253.675.693 |
| 1989 | US$ 48.513.773.721 | US$ 221.403.098.267 |
| 1988 | US$ 43.152.128.959 | US$ 181.611.150.497 |
| 1987 | US$ 37.791.488.666 | US$ 147.542.558.209 |
| 1986 | US$ 33.987.207.295 | US$ 134.556.034.673 |
| 1985 | US$ 34.961.486.348 | US$ 195.241.069.482 |
| 1984 | US$ 35.730.185.634 | US$ 184.230.754.105 |
| 1983 | US$ 37.759.179.895 | US$ 156.167.000.433 |
| 1982 | US$ 42.206.011.275 | US$ 184.602.611.610 |
| 1981 | US$ 40.499.388.869 | US$ 263.797.827.860 |
| 1980 | US$ 36.848.080.899 | US$ 205.577.055.466 |
| 1979 | US$ 31.218.296.292 | US$ 134.531.900.899 |
| 1978 | US$ 25.762.224.563 | US$ 102.648.570.299 |
| 1977 | US$ 22.283.109.803 | US$ 81.912.018.784 |
| 1976 | US$ 19.381.055.197 | US$ 88.875.923.765 |
| 1975 | US$ 16.875.240.684 | US$ 88.000.000.000 |
| 1974 | US$ 15.607.882.555 | US$ 72.000.000.000 |
| 1973 | US$ 11.412.449.735 | US$ 55.280.000.000 |
| 1972 | US$ 9.067.815.521 | US$ 45.200.000.000 |
| 1971 | US$ 8.375.075.630 | US$ 39.200.000.000 |
| 1970 | US$ 7.559.115.517 | US$ 35.520.000.000 |
| 1969 | US$ 9.571.800.653 | US$ 32.480.000.000 |
| 1968 | US$ 8.632.749.269 | US$ 29.360.000.000 |
| 1967 | US$ 7.724.873.935 | US$ 26.560.000.000 |
| 1966 | US$ 7.189.017.888 | US$ 24.320.000.000 |
| 1965 | US$ 6.517.349.772 | US$ 21.840.000.000 |
| 1964 | US$ 5.953.756.195 | US$ 20.080.000.000 |
| 1963 | US$ 5.505.023.238 | US$ 16.960.000.000 |
| 1962 | US$ 4.954.593.072 | US$ 15.200.000.000 |
| 1961 | US$ 8.171.194.425 | US$ 14.160.000.000 |
| 1960 | US$ 7.515.894.111 | US$ 13.040.000.000 |
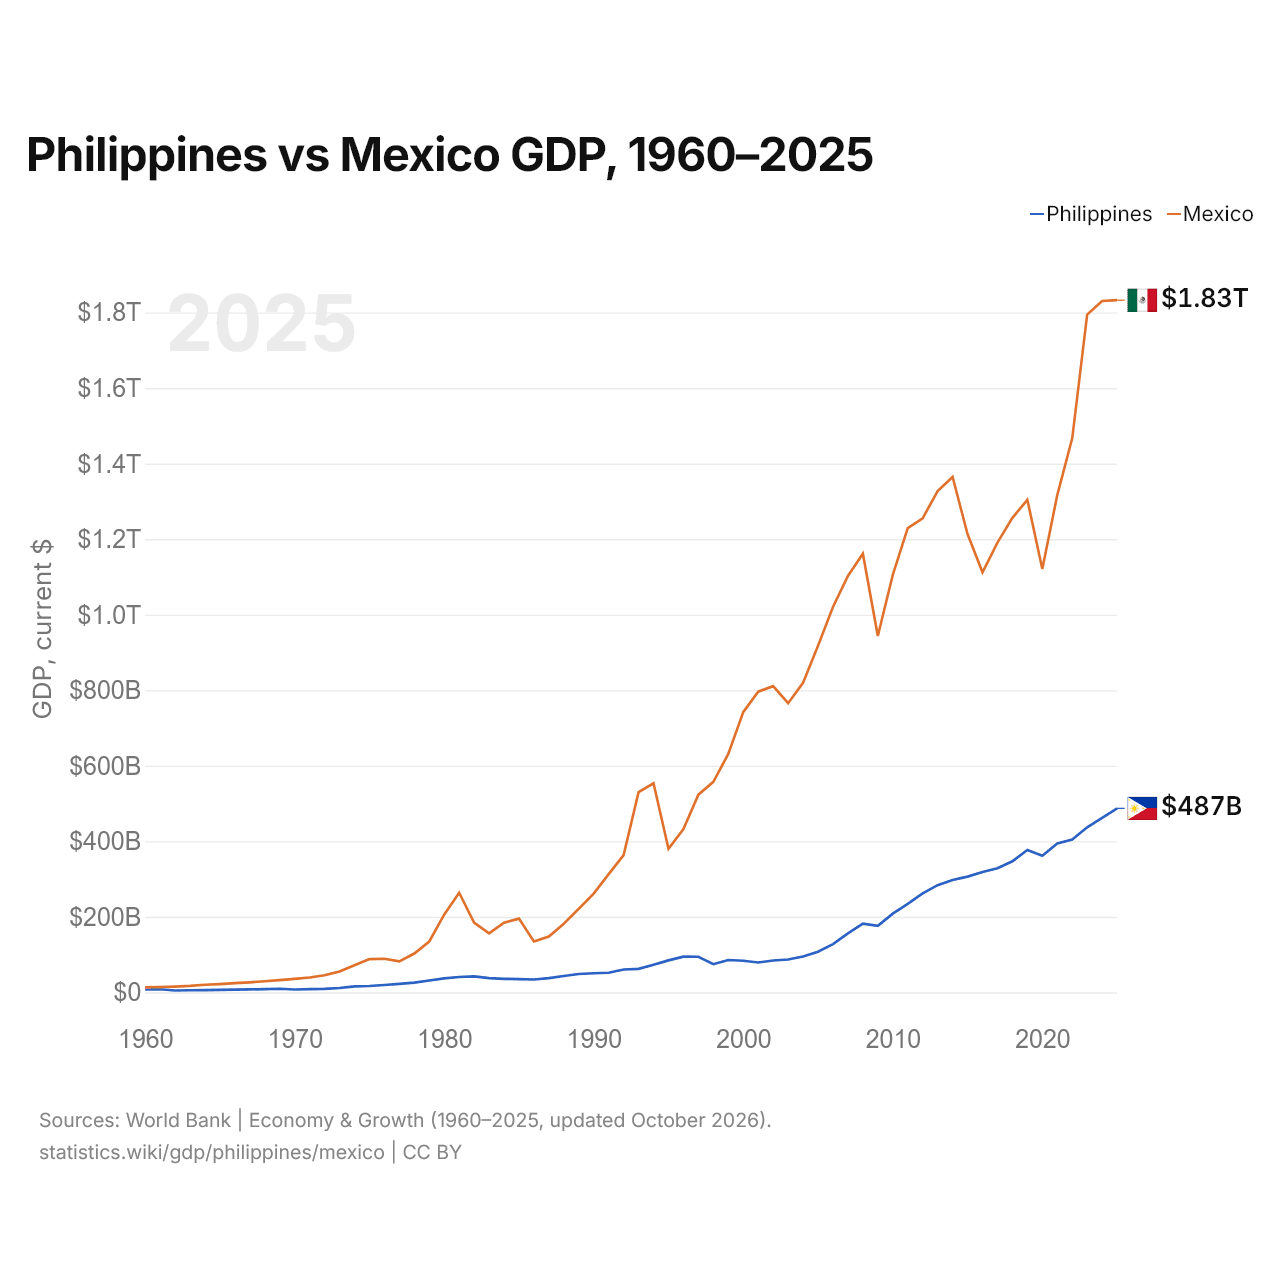
Em 2025, o PIB do México (US$ 1,83 trilhão) foi 3,8 vezes o das Filipinas (US$ 487 bilhões). Em 2015, era 4,0 vezes. De 2015 a 2025, a preços constantes de 2015, o PIB do México cresceu 11,5% e o das Filipinas, 55,0%.
Desde 1960, o PIB do México foi o maior dos dois todos os anos; em 1960, era 1,7 vezes o das Filipinas. Em 2025, o PIB per capita foi de US$ 4.171 nas Filipinas e de US$ 13.889 no México, 3,3 vezes maior no México.
Filipinas vs México: dados mais recentes do PIB
|
Filipinas
|
México
|
|
|---|---|---|
| PIB, US$ correntes | US$ 487 bi | US$ 1,83 tri |
| Posição mundial | 34/197 | 14/197 |
| Participação mundial | 0,41% | 1,55% |
| PIB, US$ constantes de 2015 | US$ 475 bi | US$ 1,35 tri |
| Diferença de PIB | 0,27× | 3,8× |
Comparar o PIB de 2 países quaisquer
Fontes:
- Banco Mundial | Economy & Growth (1960–2025, atualizado em outubro de 2026)
Creative Commons Atribuição (CC BY): você pode copiar, compartilhar, adaptar e reutilizar este conteúdo, inclusive para fins comerciais, desde que cite o statistics.wiki e indique as alterações que fizer. As fontes listadas acima podem ter suas próprias condições de licença.