
Marrocos vs Irã: PIB, 1960–2025
1x
| Ano | PIB, US$ correntes | |
|---|---|---|
 Marrocos |
 Irã |
|
| 2025 | US$ 182.374.250.612 | US$ 362.682.115.433 |
| 2024 | US$ 160.610.994.055 | US$ 475.252.089.215 |
| 2023 | US$ 146.036.093.667 | US$ 457.510.482.317 |
| 2022 | US$ 131.245.312.804 | US$ 422.662.261.526 |
| 2021 | US$ 142.022.058.447 | US$ 407.350.685.583 |
| 2020 | US$ 121.353.645.057 | US$ 280.934.329.280 |
| 2019 | US$ 128.920.266.409 | US$ 347.988.400.958 |
| 2018 | US$ 127.341.147.582 | US$ 411.903.303.606 |
| 2017 | US$ 118.540.573.368 | US$ 510.239.893.418 |
| 2016 | US$ 111.572.947.005 | US$ 478.618.064.871 |
| 2015 | US$ 110.413.823.842 | US$ 409.191.686.497 |
| 2014 | US$ 119.130.841.412 | US$ 462.284.793.281 |
| 2013 | US$ 115.739.287.305 | US$ 500.399.839.840 |
| 2012 | US$ 106.937.392.311 | US$ 644.019.315.004 |
| 2011 | US$ 110.080.631.332 | US$ 629.082.257.472 |
| 2010 | US$ 100.865.329.473 | US$ 487.069.570.464 |
| 2009 | US$ 101.154.952.241 | US$ 414.059.094.949 |
| 2008 | US$ 101.822.906.949 | US$ 406.070.949.554 |
| 2007 | US$ 86.947.913.287 | US$ 349.736.591.832 |
| 2006 | US$ 75.883.823.301 | US$ 265.602.187.404 |
| 2005 | US$ 68.852.658.069 | US$ 224.970.371.325 |
| 2004 | US$ 66.114.145.451 | US$ 187.754.571.248 |
| 2003 | US$ 58.029.363.354 | US$ 151.911.222.119 |
| 2002 | US$ 47.077.192.188 | US$ 128.626.917.504 |
| 2001 | US$ 43.831.480.208 | US$ 126.878.750.296 |
| 2000 | US$ 43.017.455.402 | US$ 109.591.707.802 |
| 1999 | US$ 46.266.428.648 | US$ 113.848.450.088 |
| 1998 | US$ 46.497.608.725 | US$ 110.276.913.363 |
| 1997 | US$ 39.147.844.526 | US$ 113.919.163.421 |
| 1996 | US$ 43.161.571.528 | US$ 120.403.931.885 |
| 1995 | US$ 39.030.285.468 | US$ 96.419.225.744 |
| 1994 | US$ 35.604.137.423 | US$ 71.841.461.173 |
| 1993 | US$ 31.655.473.664 | US$ 63.743.623.232 |
| 1992 | US$ 33.711.069.431 | US$ 119.768.691.217 |
| 1991 | US$ 32.285.573.574 | US$ 131.637.664.958 |
| 1990 | US$ 30.179.954.775 | US$ 124.813.263.926 |
| 1989 | US$ 26.314.313.191 | US$ 120.496.362.916 |
| 1988 | US$ 25.705.296.184 | US$ 123.057.861.334 |
| 1987 | US$ 21.765.195.948 | US$ 134.009.995.923 |
| 1986 | US$ 19.462.085.540 | US$ 209.094.561.833 |
| 1985 | US$ 14.991.283.216 | US$ 180.183.629.600 |
| 1984 | US$ 14.824.667.954 | US$ 162.276.728.620 |
| 1983 | US$ 16.251.408.128 | US$ 156.365.156.618 |
| 1982 | US$ 17.692.276.734 | US$ 125.948.756.439 |
| 1981 | US$ 17.788.185.479 | US$ 100.499.312.750 |
| 1980 | US$ 21.728.516.153 | US$ 94.362.275.580 |
| 1979 | US$ 15.911.994.817 | US$ 90.391.877.326 |
| 1978 | US$ 13.236.946.234 | US$ 77.994.316.621 |
| 1977 | US$ 11.049.783.872 | US$ 80.600.122.702 |
| 1976 | US$ 9.584.297.284 | US$ 68.055.295.081 |
| 1975 | US$ 8.984.853.005 | US$ 51.776.222.350 |
| 1974 | US$ 7.675.466.449 | US$ 46.209.092.072 |
| 1973 | US$ 6.242.145.880 | US$ 27.081.698.250 |
| 1972 | US$ 5.074.117.545 | US$ 17.153.463.263 |
| 1971 | US$ 4.356.669.034 | US$ 13.731.802.833 |
| 1970 | US$ 3.956.336.244 | US$ 10.976.245.154 |
| 1969 | US$ 3.651.622.669 | US$ 9.743.089.607 |
| 1968 | US$ 3.271.422.333 | US$ 8.623.172.960 |
| 1967 | US$ 3.046.345.314 | US$ 7.555.383.690 |
| 1966 | US$ 2.876.401.297 | US$ 6.789.938.672 |
| 1965 | US$ 2.948.331.090 | US$ 6.197.319.929 |
| 1964 | US$ 2.798.345.299 | US$ 5.379.845.648 |
| 1963 | US$ 2.657.252.578 | US$ 4.928.628.018 |
| 1962 | US$ 2.379.611.125 | US$ 4.693.566.416 |
| 1961 | US$ 2.025.693.540 | US$ 4.426.949.095 |
| 1960 | US$ 2.037.154.742 | US$ 4.199.134.390 |
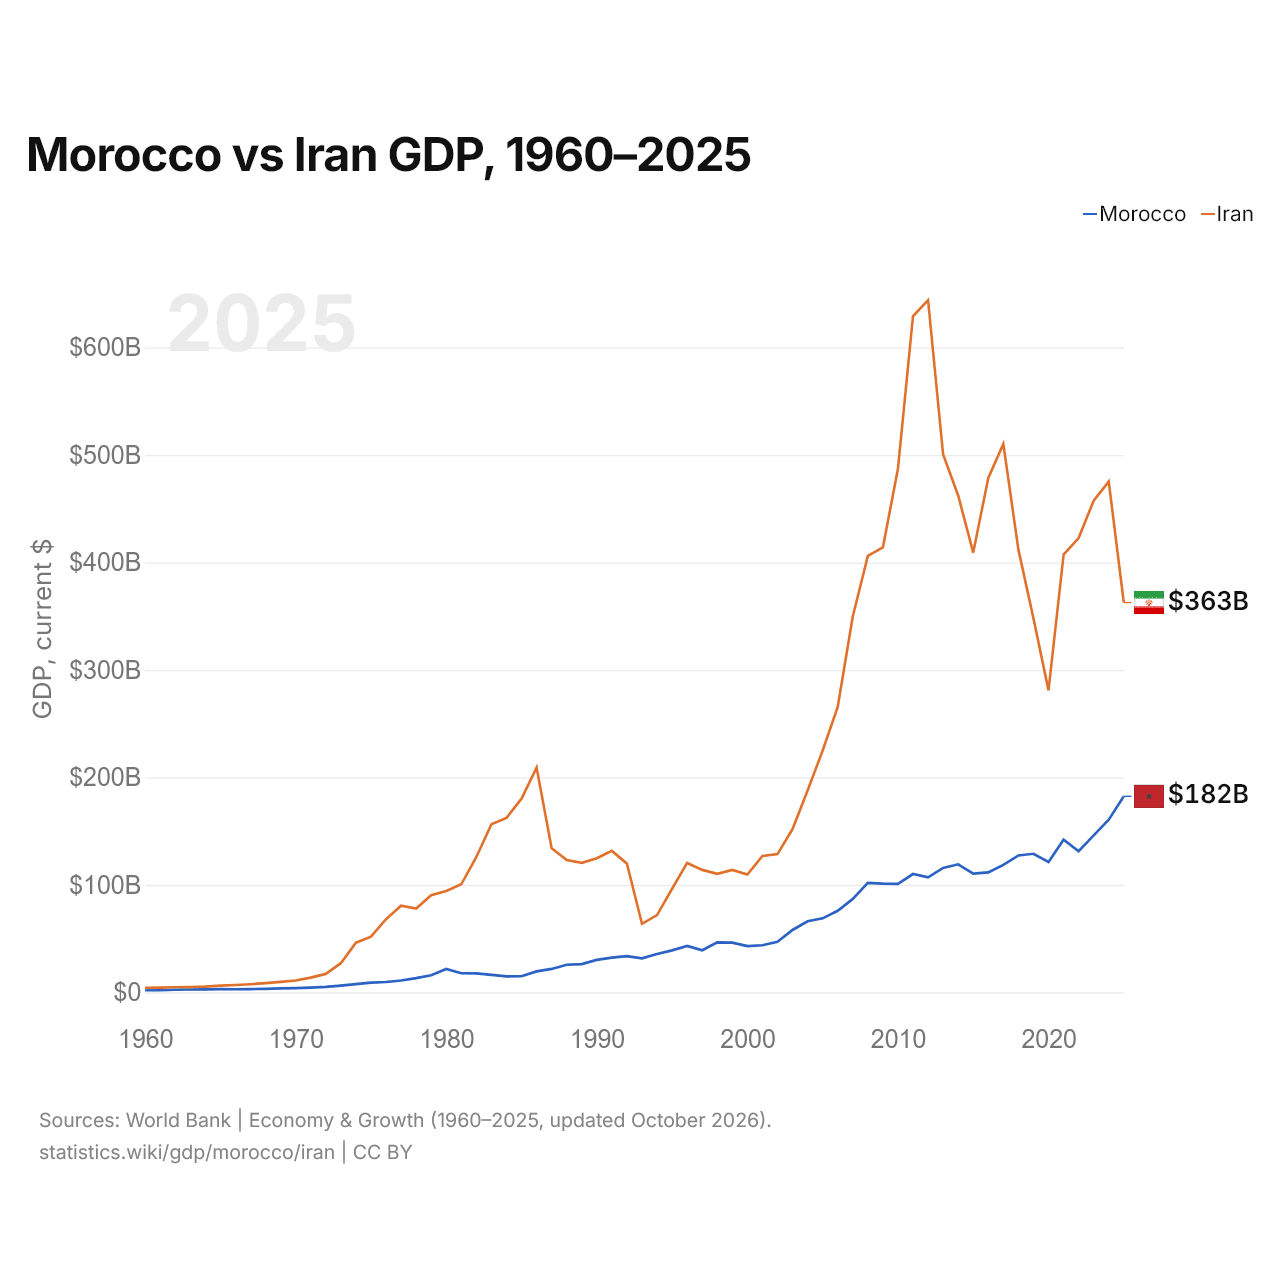
Em 2025, o PIB do Irã (US$ 363 bilhões) foi 2,0 vezes o do Marrocos (US$ 182 bilhões). Em 2015, era 3,7 vezes. De 2015 a 2025, a preços constantes de 2015, o PIB do Irã cresceu 26,9% e o do Marrocos, 28,8%.
Desde 1960, o PIB do Irã foi o maior dos dois todos os anos; em 1960, era 2,1 vezes o do Marrocos. Em 2025, o PIB per capita foi de US$ 4.746 no Marrocos e de US$ 3.924 no Irã, 21% maior no Marrocos.
Marrocos vs Irã: dados mais recentes do PIB
|
Marrocos
|
Irã
|
|
|---|---|---|
| PIB, US$ correntes | US$ 182 bi | US$ 363 bi |
| Posição mundial | 58/197 | 44/197 |
| Participação mundial | 0,15% | 0,31% |
| PIB, US$ constantes de 2015 | US$ 142 bi | US$ 519 bi |
| Diferença de PIB | 0,5× | 2× |
Comparar o PIB de 2 países quaisquer
Fontes:
- Banco Mundial | Economy & Growth (1960–2025, atualizado em outubro de 2026)
Creative Commons Atribuição (CC BY): você pode copiar, compartilhar, adaptar e reutilizar este conteúdo, inclusive para fins comerciais, desde que cite o statistics.wiki e indique as alterações que fizer. As fontes listadas acima podem ter suas próprias condições de licença.