
Gana vs Argélia: PIB, 1960–2025
1x
| Ano | PIB, US$ correntes | |
|---|---|---|
 Gana |
 Argélia |
|
| 2025 | US$ 114.209.905.279 | US$ 287.031.225.988 |
| 2024 | US$ 83.288.585.604 | US$ 269.322.281.665 |
| 2023 | US$ 80.547.146.876 | US$ 247.923.887.215 |
| 2022 | US$ 73.919.003.212 | US$ 225.581.644.703 |
| 2021 | US$ 79.514.204.730 | US$ 186.231.205.262 |
| 2020 | US$ 70.008.243.860 | US$ 164.873.415.325 |
| 2019 | US$ 68.352.629.246 | US$ 193.459.662.091 |
| 2018 | US$ 67.259.353.966 | US$ 194.554.483.656 |
| 2017 | US$ 60.385.409.435 | US$ 189.880.896.903 |
| 2016 | US$ 56.144.179.398 | US$ 180.763.839.522 |
| 2015 | US$ 49.436.806.230 | US$ 187.493.855.609 |
| 2014 | US$ 54.678.533.806 | US$ 238.942.664.193 |
| 2013 | US$ 62.845.721.960 | US$ 229.701.430.292 |
| 2012 | US$ 41.271.701.061 | US$ 227.143.746.076 |
| 2011 | US$ 39.336.668.081 | US$ 218.331.946.925 |
| 2010 | US$ 32.197.655.567 | US$ 177.785.053.940 |
| 2009 | US$ 26.048.720.006 | US$ 150.317.292.079 |
| 2008 | US$ 28.679.383.241 | US$ 180.383.848.331 |
| 2007 | US$ 24.827.339.138 | US$ 142.482.739.810 |
| 2006 | US$ 20.885.037.597 | US$ 123.084.258.693 |
| 2005 | US$ 10.744.568.381 | US$ 107.046.618.670 |
| 2004 | US$ 8.881.417.907 | US$ 91.913.680.985 |
| 2003 | US$ 7.632.723.556 | US$ 73.482.264.191 |
| 2002 | US$ 6.166.197.848 | US$ 61.516.103.406 |
| 2001 | US$ 5.314.872.854 | US$ 59.413.400.924 |
| 2000 | US$ 4.982.850.662 | US$ 54.790.398.570 |
| 1999 | US$ 7.718.109.982 | US$ 48.640.671.735 |
| 1998 | US$ 7.482.069.162 | US$ 48.187.781.984 |
| 1997 | US$ 6.891.443.192 | US$ 48.177.612.042 |
| 1996 | US$ 6.932.991.739 | US$ 46.941.554.225 |
| 1995 | US$ 6.464.382.808 | US$ 41.764.291.672 |
| 1994 | US$ 5.446.383.727 | US$ 42.543.176.829 |
| 1993 | US$ 5.968.922.939 | US$ 49.945.584.453 |
| 1992 | US$ 6.416.103.926 | US$ 48.003.133.347 |
| 1991 | US$ 6.603.185.268 | US$ 45.715.676.428 |
| 1990 | US$ 5.889.106.573 | US$ 62.048.507.531 |
| 1989 | US$ 5.251.858.440 | US$ 55.634.721.573 |
| 1988 | US$ 5.197.765.032 | US$ 59.089.396.860 |
| 1987 | US$ 5.074.829.932 | US$ 66.745.818.375 |
| 1986 | US$ 5.735.677.434 | US$ 63.692.007.897 |
| 1985 | US$ 4.504.306.723 | US$ 57.937.868.670 |
| 1984 | US$ 4.412.279.843 | US$ 53.698.548.293 |
| 1983 | US$ 4.057.275.132 | US$ 48.801.369.800 |
| 1982 | US$ 4.035.994.398 | US$ 45.207.167.470 |
| 1981 | US$ 4.222.441.860 | US$ 44.348.590.461 |
| 1980 | US$ 4.445.228.216 | US$ 42.345.829.079 |
| 1979 | US$ 4.020.227.920 | US$ 33.243.706.860 |
| 1978 | US$ 3.662.478.185 | US$ 26.364.491.313 |
| 1977 | US$ 3.189.428.571 | US$ 20.972.113.685 |
| 1976 | US$ 2.765.254.237 | US$ 17.728.240.932 |
| 1975 | US$ 2.810.106.383 | US$ 15.557.902.754 |
| 1974 | US$ 2.894.409.938 | US$ 13.209.871.626 |
| 1973 | US$ 3.006.766.758 | US$ 8.707.858.912 |
| 1972 | US$ 2.112.293.280 | US$ 6.766.743.957 |
| 1971 | US$ 2.417.108.578 | US$ 5.077.183.094 |
| 1970 | US$ 2.215.028.588 | US$ 4.863.526.897 |
| 1969 | US$ 1.962.050.556 | US$ 4.257.253.264 |
| 1968 | US$ 1.666.909.518 | US$ 3.852.147.027 |
| 1967 | US$ 1.747.187.645 | US$ 3.370.870.376 |
| 1966 | US$ 2.126.300.672 | US$ 3.039.859.187 |
| 1965 | US$ 2.053.462.968 | US$ 3.136.284.307 |
| 1964 | US$ 1.731.296.200 | US$ 2.909.316.435 |
| 1963 | US$ 1.540.797.589 | US$ 2.702.982.018 |
| 1962 | US$ 1.382.515.654 | US$ 2.001.444.544 |
| 1961 | US$ 1.302.674.325 | US$ 2.434.747.056 |
| 1960 | US$ 1.217.230.095 | US$ 2.723.615.451 |
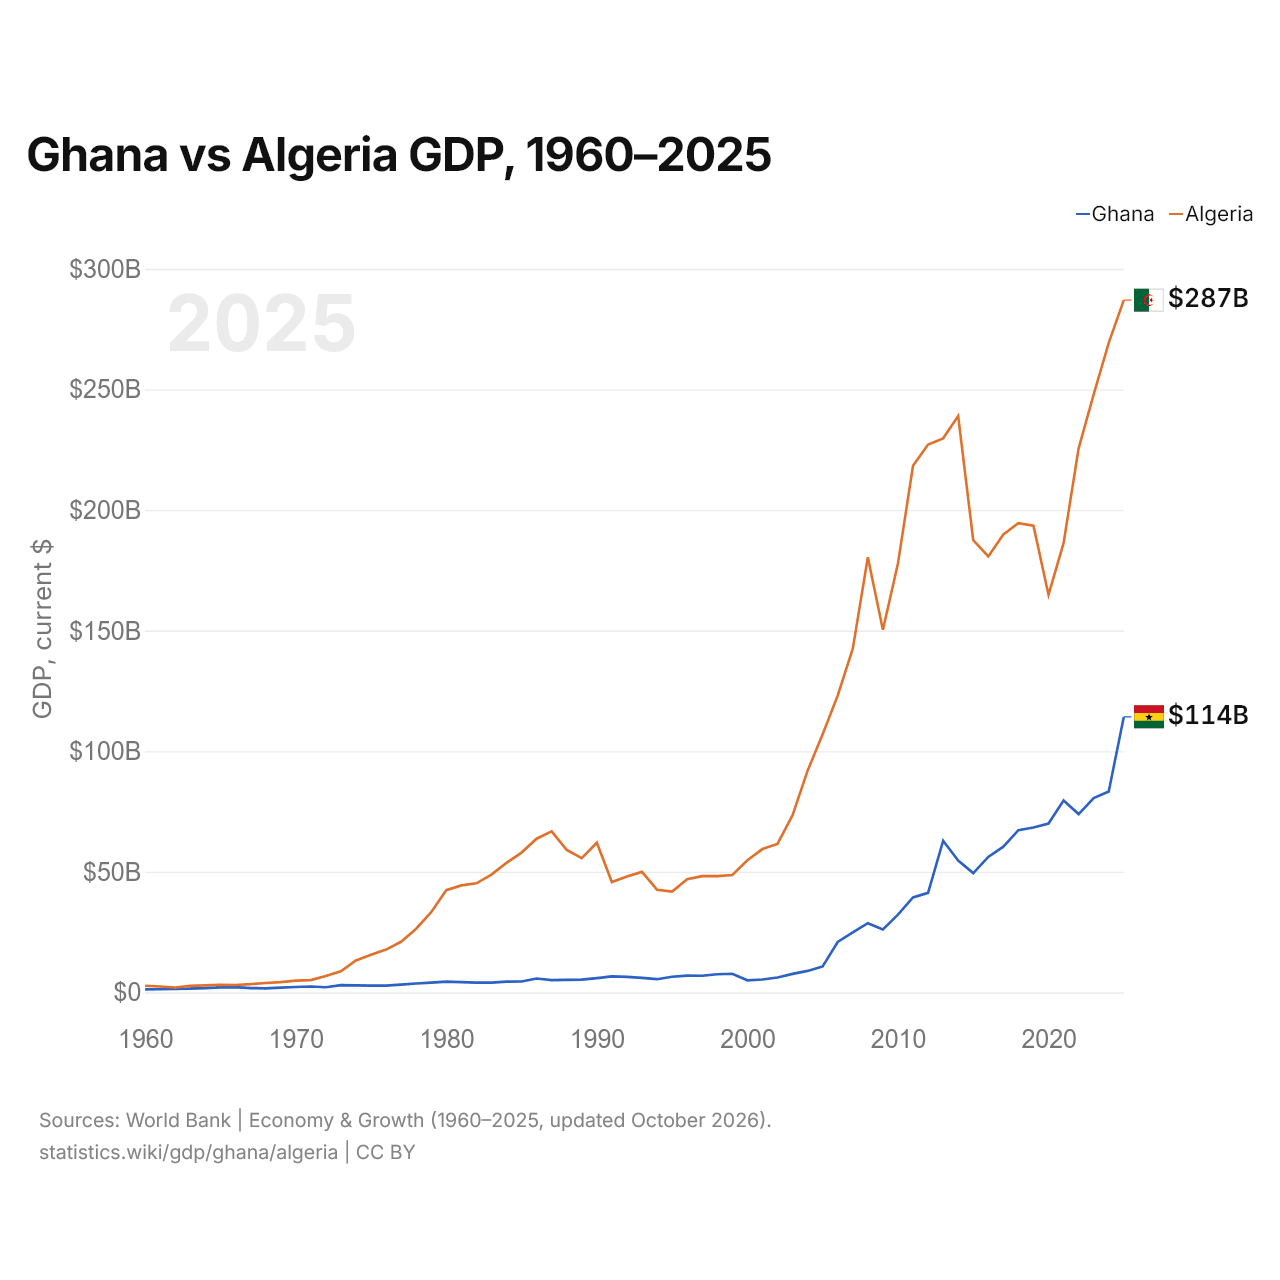
Em 2025, o PIB da Argélia (US$ 287 bilhões) foi 2,5 vezes o de Gana (US$ 114 bilhões). Em 2015, era 3,8 vezes. De 2015 a 2025, a preços constantes de 2015, o PIB da Argélia cresceu 23,5% e o de Gana, 60,3%.
Desde 1960, o PIB da Argélia foi o maior dos dois todos os anos; em 1960, era 2,2 vezes o de Gana. Em 2025, o PIB per capita foi de US$ 3.257 em Gana e de US$ 6.051 na Argélia, 1,9 vezes maior na Argélia.
Gana vs Argélia: dados mais recentes do PIB
|
Gana
|
Argélia
|
|
|---|---|---|
| PIB, US$ correntes | US$ 114 bi | US$ 287 bi |
| Posição mundial | 69/197 | 51/197 |
| Participação mundial | 0,1% | 0,24% |
| PIB, US$ constantes de 2015 | US$ 79,3 bi | US$ 232 bi |
| Diferença de PIB | 0,4× | 2,5× |
Comparar o PIB de 2 países quaisquer
Fontes:
- Banco Mundial | Economy & Growth (1960–2025, atualizado em outubro de 2026)
Creative Commons Atribuição (CC BY): você pode copiar, compartilhar, adaptar e reutilizar este conteúdo, inclusive para fins comerciais, desde que cite o statistics.wiki e indique as alterações que fizer. As fontes listadas acima podem ter suas próprias condições de licença.