
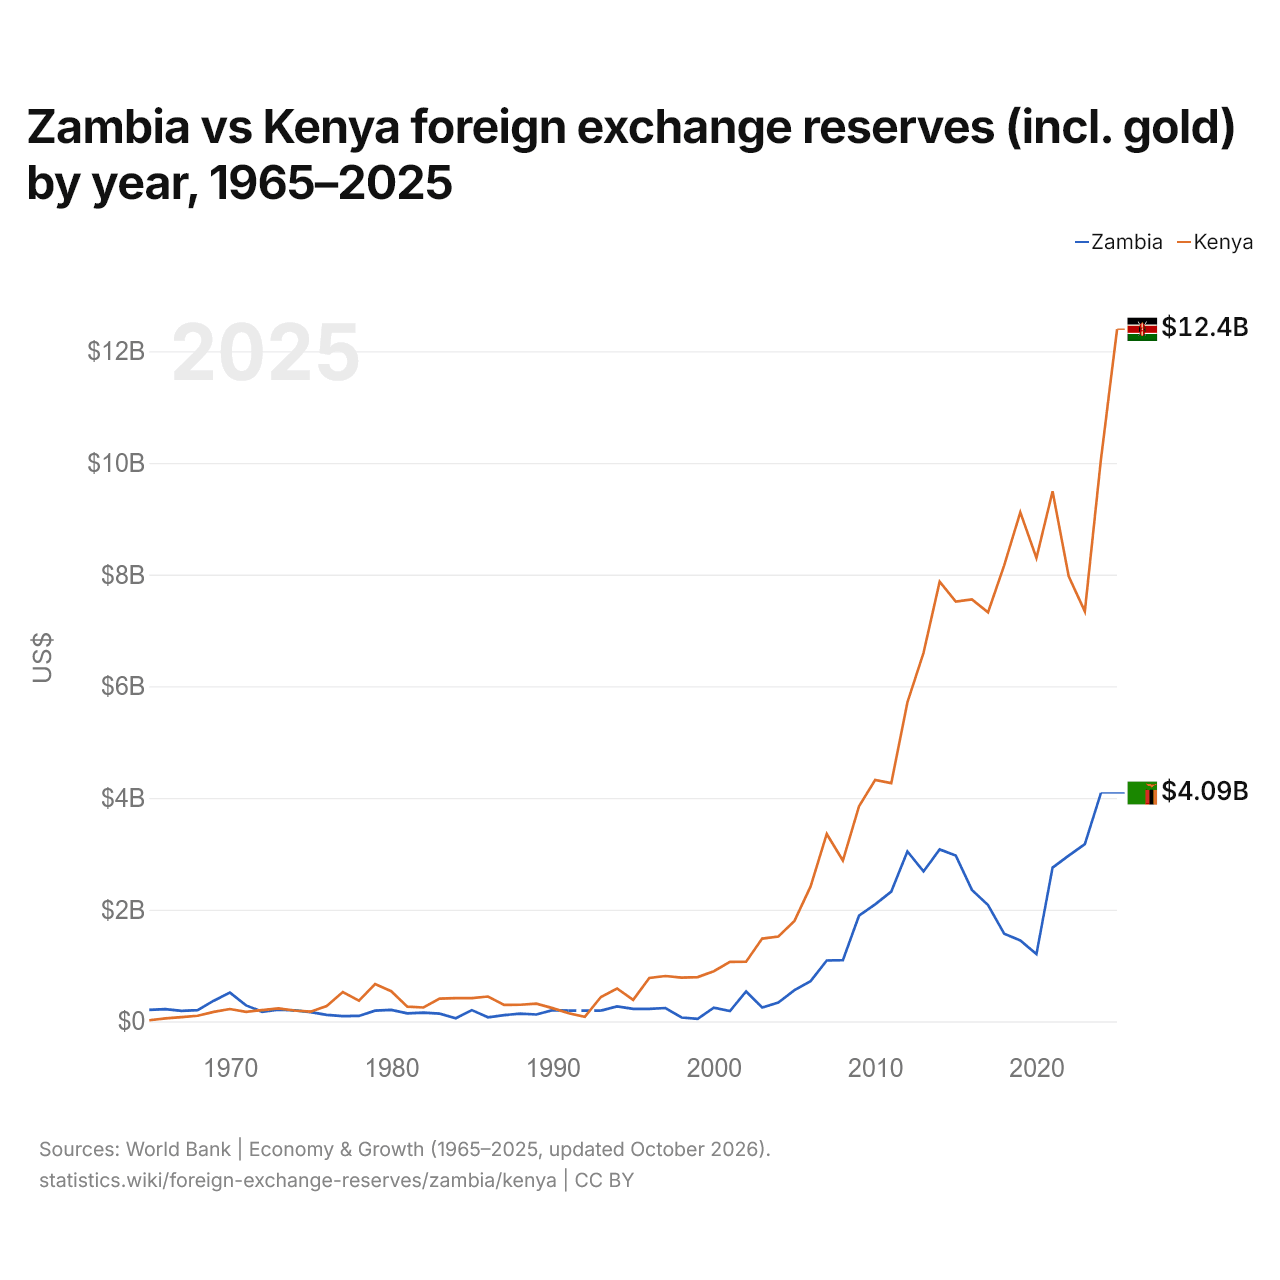
Zâmbia vs Quênia: reservas internacionais (incluindo ouro) por ano, 1965–2025
1x
| Ano | US$ | |
|---|---|---|
 Zâmbia |
 Quênia |
|
| 2025 | - | US$ 12.394.288.741 |
| 2024 | US$ 4.089.834.508 | US$ 10.066.607.177 |
| 2023 | US$ 3.173.177.777 | US$ 7.341.776.190 |
| 2022 | US$ 2.967.565.317 | US$ 7.969.488.013 |
| 2021 | US$ 2.753.875.454 | US$ 9.490.896.581 |
| 2020 | US$ 1.203.448.374 | US$ 8.297.263.559 |
| 2019 | US$ 1.448.624.290 | US$ 9.115.806.005 |
| 2018 | US$ 1.569.229.906 | US$ 8.164.380.806 |
| 2017 | US$ 2.082.083.920 | US$ 7.325.420.063 |
| 2016 | US$ 2.352.719.004 | US$ 7.553.884.913 |
| 2015 | US$ 2.967.626.716 | US$ 7.514.864.907 |
| 2014 | US$ 3.078.362.297 | US$ 7.874.414.432 |
| 2013 | US$ 2.683.813.403 | US$ 6.598.881.869 |
| 2012 | US$ 3.042.223.849 | US$ 5.711.831.325 |
| 2011 | US$ 2.324.018.127 | US$ 4.265.145.710 |
| 2010 | US$ 2.093.753.266 | US$ 4.320.858.499 |
| 2009 | US$ 1.892.077.713 | US$ 3.849.500.809 |
| 2008 | US$ 1.095.608.609 | US$ 2.878.951.355 |
| 2007 | US$ 1.089.952.023 | US$ 3.355.419.016 |
| 2006 | US$ 719.716.912 | US$ 2.416.073.243 |
| 2005 | US$ 559.788.508 | US$ 1.799.087.913 |
| 2004 | US$ 337.106.225 | US$ 1.519.538.697 |
| 2003 | US$ 247.729.407 | US$ 1.482.117.159 |
| 2002 | US$ 535.132.846 | US$ 1.068.140.537 |
| 2001 | US$ 183.446.872 | US$ 1.064.987.677 |
| 2000 | US$ 244.824.132 | US$ 897.865.882 |
| 1999 | US$ 45.429.576 | US$ 791.589.618 |
| 1998 | US$ 69.382.430 | US$ 783.051.364 |
| 1997 | US$ 239.085.490 | US$ 811.092.756 |
| 1996 | US$ 222.709.085 | US$ 775.927.062 |
| 1995 | US$ 222.702.264 | US$ 384.262.966 |
| 1994 | US$ 268.127.772 | US$ 588.142.007 |
| 1993 | US$ 192.326.098 | US$ 436.745.056 |
| 1992 | - | US$ 79.549.253 |
| 1991 | US$ 192.407.809 | US$ 145.138.376 |
| 1990 | US$ 201.213.453 | US$ 236.115.155 |
| 1989 | US$ 123.043.283 | US$ 316.624.629 |
| 1988 | US$ 139.360.164 | US$ 296.453.946 |
| 1987 | US$ 110.764.773 | US$ 294.401.563 |
| 1986 | US$ 71.497.164 | US$ 444.494.690 |
| 1985 | US$ 201.091.984 | US$ 416.724.735 |
| 1984 | US$ 54.826.402 | US$ 414.388.462 |
| 1983 | US$ 137.306.439 | US$ 406.428.159 |
| 1982 | US$ 157.342.358 | US$ 248.102.847 |
| 1981 | US$ 142.426.332 | US$ 262.828.031 |
| 1980 | US$ 206.121.500 | US$ 538.712.189 |
| 1979 | US$ 191.063.142 | US$ 668.545.449 |
| 1978 | US$ 96.515.885 | US$ 368.830.302 |
| 1977 | US$ 94.022.882 | US$ 525.784.883 |
| 1976 | US$ 115.298.692 | US$ 275.522.172 |
| 1975 | US$ 165.564.753 | US$ 173.405.884 |
| 1974 | US$ 195.695.676 | US$ 193.282.886 |
| 1973 | US$ 207.974.127 | US$ 233.045.795 |
| 1972 | US$ 171.375.429 | US$ 201.994.376 |
| 1971 | US$ 285.818.118 | US$ 170.946.360 |
| 1970 | US$ 514.838.710 | US$ 219.830.000 |
| 1969 | US$ 369.381.600 | US$ 169.660.000 |
| 1968 | US$ 201.207.700 | US$ 100.050.000 |
| 1967 | US$ 187.327.600 | US$ 75.830.000 |
| 1966 | US$ 217.613.970 | US$ 52.400.000 |
| 1965 | US$ 203.871.760 | US$ 19.950.000 |
As reservas internacionais da Zâmbia foram de US$ 4,09 bilhões (2024) e as do Quênia, de US$ 10,1 bilhões (2024): as do Quênia foram 2,5 vezes maiores. Em 1965, as reservas da Zâmbia foram 10 vezes maiores: US$ 204 milhões da Zâmbia e US$ 20 milhões do Quênia.
Zâmbia vs Quênia: reservas, incluindo ouro, e meses de importações cobertos
|
Zâmbia
|
Quênia
|
|
|---|---|---|
| Reservas, incluindo ouro | US$ 4,09 bi (2024) | US$ 12,4 bi (2025) |
| Meses de importações | 7,0 (2024) | 5,0 (2025) |
| Posição mundial | 107/168 | 75/168 |
Comparar as reservas internacionais de 2 países quaisquer
Fontes:
- Banco Mundial | Economy & Growth (1965–2025, atualizado em outubro de 2026)
Creative Commons Atribuição (CC BY): você pode copiar, compartilhar, adaptar e reutilizar este conteúdo, inclusive para fins comerciais, desde que cite o statistics.wiki e indique as alterações que fizer. As fontes listadas acima podem ter suas próprias condições de licença.