
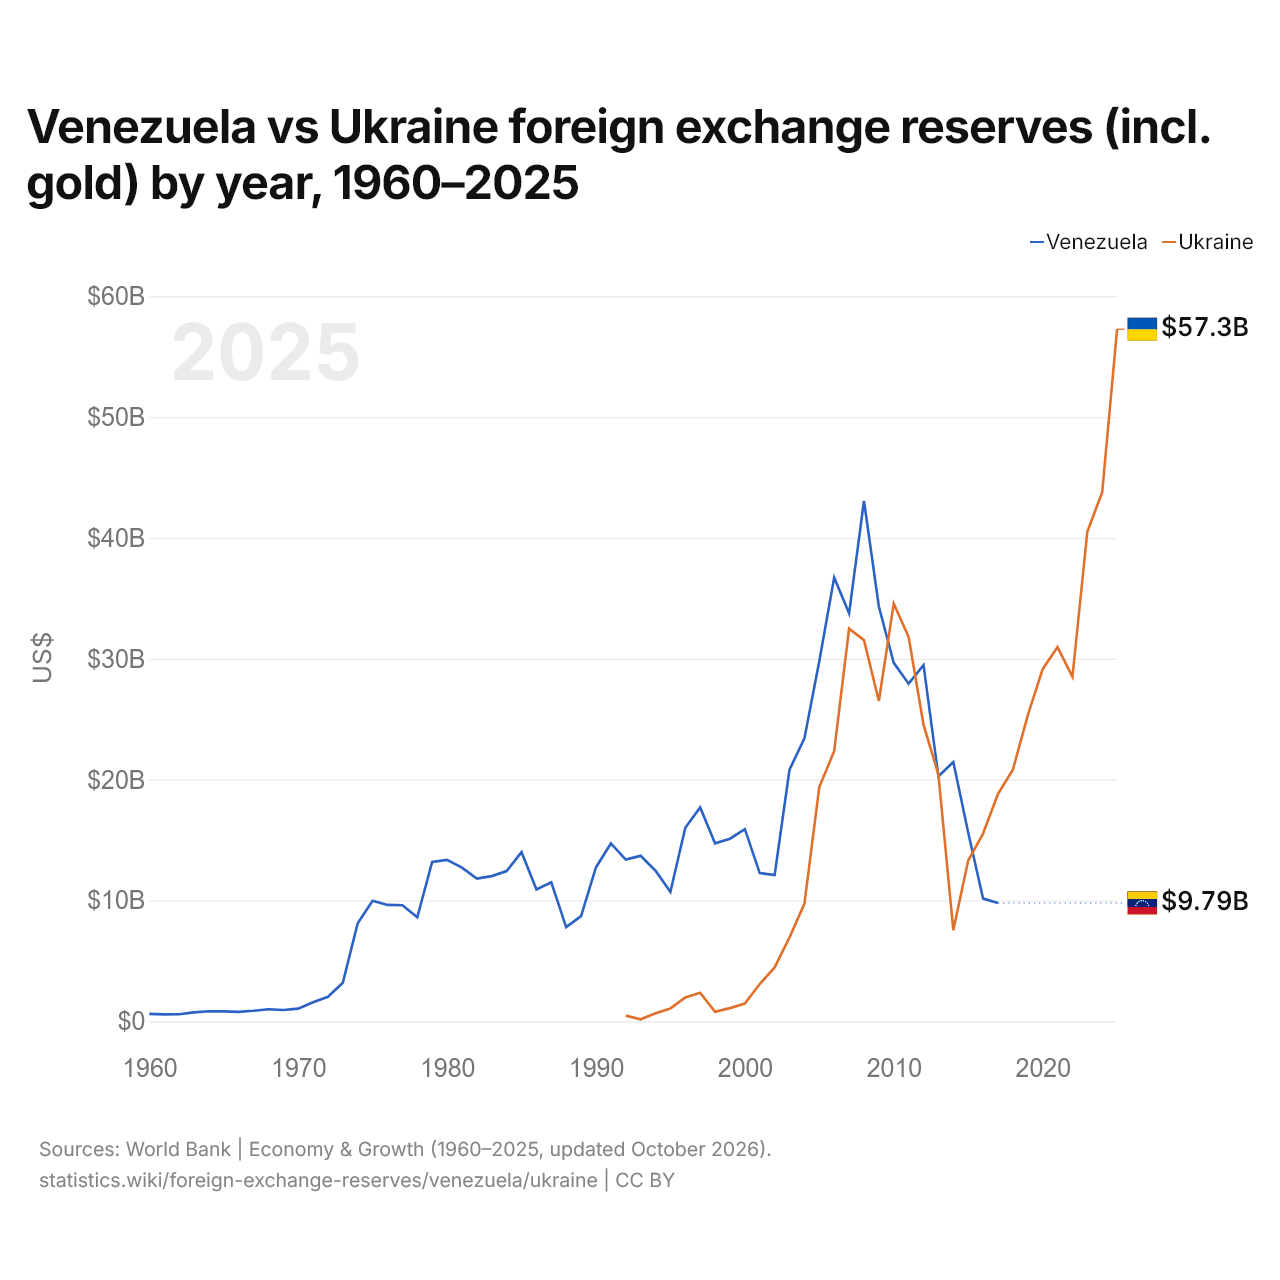
Venezuela vs Ucrânia: reservas internacionais (incluindo ouro) por ano, 1960–2025
1x
| Ano | US$ | |
|---|---|---|
 Venezuela |
 Ucrânia |
|
| 2025 | - | US$ 57.268.434.039 |
| 2024 | - | US$ 43.780.549.773 |
| 2023 | - | US$ 40.510.106.308 |
| 2022 | - | US$ 28.505.931.892 |
| 2021 | - | US$ 30.966.674.654 |
| 2020 | - | US$ 29.137.541.200 |
| 2019 | - | US$ 25.317.002.927 |
| 2018 | - | US$ 20.817.897.004 |
| 2017 | US$ 9.794.062.065 | US$ 18.810.931.197 |
| 2016 | US$ 10.150.000.484 | US$ 15.537.256.304 |
| 2015 | US$ 15.625.329.212 | US$ 13.300.880.765 |
| 2014 | US$ 21.454.894.042 | US$ 7.538.804.512 |
| 2013 | US$ 20.275.216.409 | US$ 20.413.621.999 |
| 2012 | US$ 29.468.789.163 | US$ 24.552.796.497 |
| 2011 | US$ 27.934.651.459 | US$ 31.788.750.907 |
| 2010 | US$ 29.665.473.906 | US$ 34.571.298.928 |
| 2009 | US$ 34.317.956.994 | US$ 26.500.887.342 |
| 2008 | US$ 43.065.463.087 | US$ 31.543.343.237 |
| 2007 | US$ 33.759.218.865 | US$ 32.483.841.813 |
| 2006 | US$ 36.715.128.120 | US$ 22.359.564.313 |
| 2005 | US$ 29.802.940.548 | US$ 19.388.177.691 |
| 2004 | US$ 23.408.050.057 | US$ 9.718.436.096 |
| 2003 | US$ 20.820.560.021 | US$ 6.946.076.994 |
| 2002 | US$ 12.106.510.811 | US$ 4.462.353.859 |
| 2001 | US$ 12.264.400.223 | US$ 3.088.921.703 |
| 2000 | US$ 15.898.851.163 | US$ 1.477.202.336 |
| 1999 | US$ 15.110.150.346 | US$ 1.093.527.812 |
| 1998 | US$ 14.728.840.877 | US$ 792.954.527 |
| 1997 | US$ 17.703.782.562 | US$ 2.358.910.867 |
| 1996 | US$ 16.019.843.787 | US$ 1.971.655.947 |
| 1995 | US$ 10.715.241.771 | US$ 1.068.754.172 |
| 1994 | US$ 12.459.340.632 | US$ 664.538.695 |
| 1993 | US$ 13.692.654.317 | US$ 166.106.210 |
| 1992 | US$ 13.381.434.154 | US$ 468.913.725 |
| 1991 | US$ 14.718.563.242 | - |
| 1990 | US$ 12.732.617.577 | - |
| 1989 | US$ 8.701.843.815 | - |
| 1988 | US$ 7.793.015.713 | - |
| 1987 | US$ 11.510.455.565 | - |
| 1986 | US$ 10.917.160.675 | - |
| 1985 | US$ 13.998.194.165 | - |
| 1984 | US$ 12.434.220.776 | - |
| 1983 | US$ 12.014.837.512 | - |
| 1982 | US$ 11.814.610.376 | - |
| 1981 | US$ 12.719.712.433 | - |
| 1980 | US$ 13.359.613.705 | - |
| 1979 | US$ 13.187.812.581 | - |
| 1978 | US$ 8.608.724.774 | - |
| 1977 | US$ 9.602.436.275 | - |
| 1976 | US$ 9.630.263.782 | - |
| 1975 | US$ 9.970.588.619 | - |
| 1974 | US$ 8.119.250.127 | - |
| 1973 | US$ 3.193.881.780 | - |
| 1972 | US$ 2.031.779.426 | - |
| 1971 | US$ 1.584.139.131 | - |
| 1970 | US$ 1.046.548.900 | - |
| 1969 | US$ 935.072.000 | - |
| 1968 | US$ 1.000.929.000 | - |
| 1967 | US$ 873.902.000 | - |
| 1966 | US$ 778.787.400 | - |
| 1965 | US$ 819.985.200 | - |
| 1964 | US$ 832.985.200 | - |
| 1963 | US$ 745.526.800 | - |
| 1962 | US$ 583.412.200 | - |
| 1961 | US$ 581.329.000 | - |
| 1960 | US$ 615.486.000 | - |
As reservas internacionais da Venezuela são de US$ 9,79 bilhões (2017), e as da Ucrânia, de US$ 57,3 bilhões (2025). Em 1992, as reservas da Venezuela foram 29 vezes maiores: US$ 13,4 bilhões da Venezuela e US$ 469 milhões da Ucrânia.
Venezuela vs Ucrânia: reservas, incluindo ouro, e meses de importações cobertos
|
Venezuela
|
Ucrânia
|
|
|---|---|---|
| Reservas, incluindo ouro | US$ 9,79 bi (2017) | US$ 57,3 bi (2025) |
| Meses de importações | 10,9 (2017) | 6,2 (2025) |
| Posição mundial | Sem classificação | 44/168 |
Comparar as reservas internacionais de 2 países quaisquer
Fontes:
- Banco Mundial | Economy & Growth (1960–2025, atualizado em outubro de 2026)
Creative Commons Atribuição (CC BY): você pode copiar, compartilhar, adaptar e reutilizar este conteúdo, inclusive para fins comerciais, desde que cite o statistics.wiki e indique as alterações que fizer. As fontes listadas acima podem ter suas próprias condições de licença.