
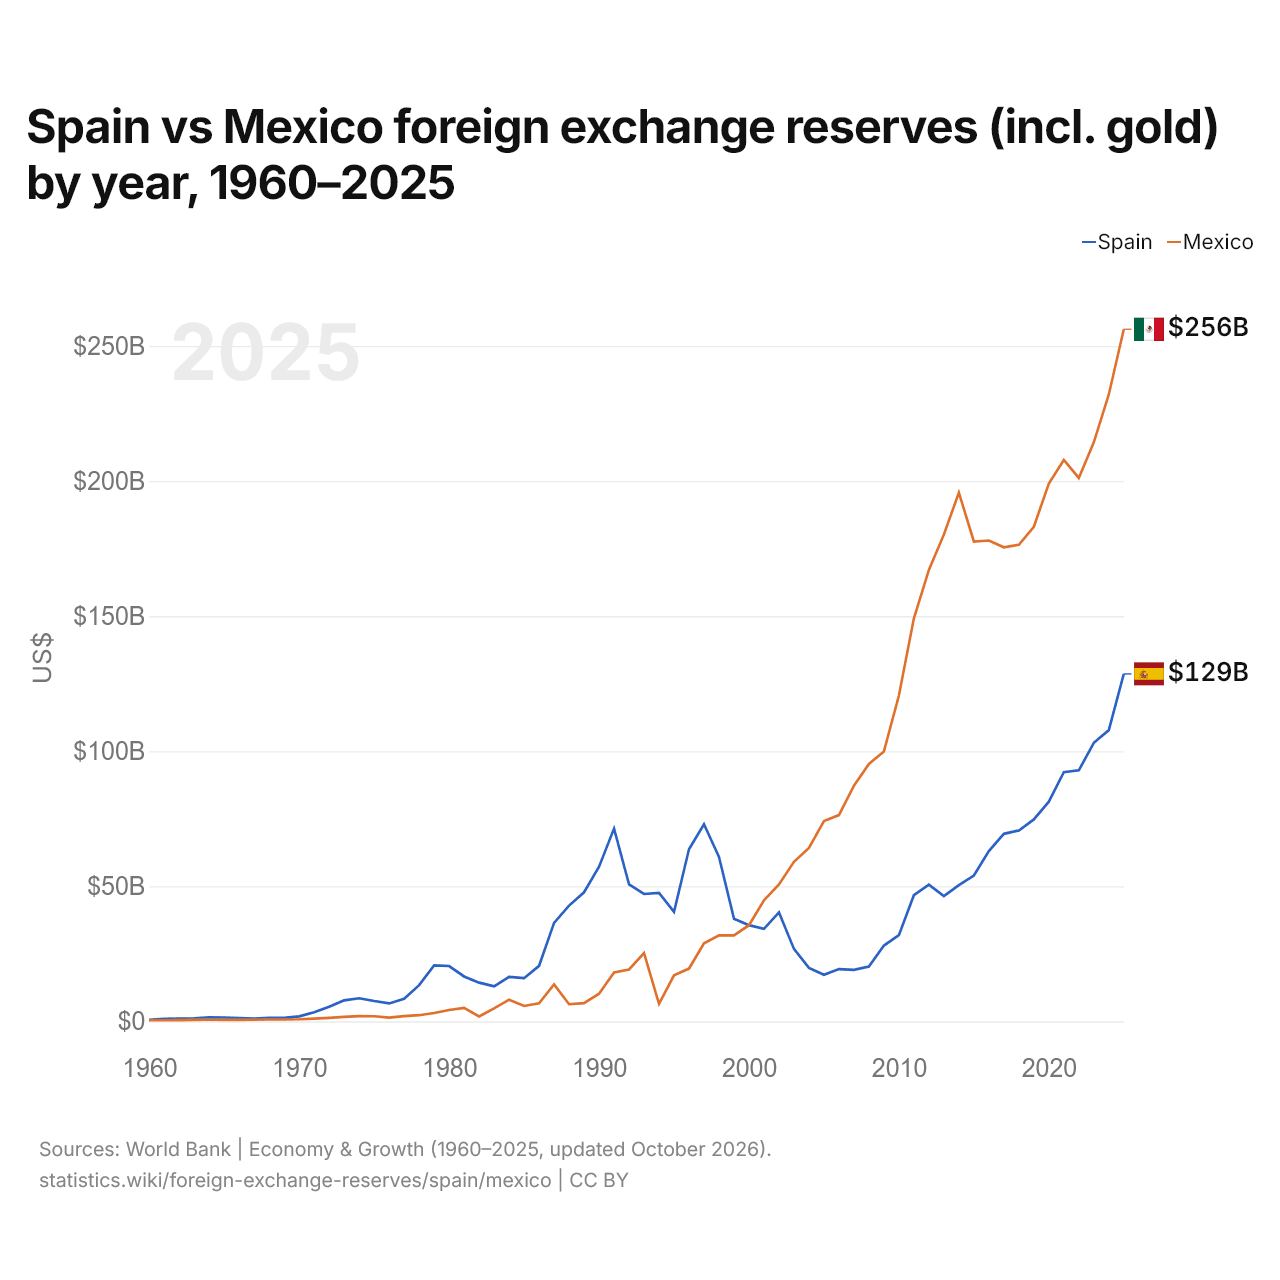
Espanha vs México: reservas internacionais (incluindo ouro) por ano, 1960–2025
1x
| Ano | US$ | |
|---|---|---|
 Espanha |
 México |
|
| 2025 | US$ 128.593.472.896 | US$ 256.178.680.249 |
| 2024 | US$ 107.774.143.969 | US$ 232.035.392.465 |
| 2023 | US$ 103.088.315.528 | US$ 214.316.827.085 |
| 2022 | US$ 92.905.070.060 | US$ 201.118.689.946 |
| 2021 | US$ 92.201.269.195 | US$ 207.799.490.381 |
| 2020 | US$ 81.287.702.461 | US$ 199.069.188.921 |
| 2019 | US$ 74.731.427.284 | US$ 183.056.094.118 |
| 2018 | US$ 70.633.189.428 | US$ 176.390.278.596 |
| 2017 | US$ 69.400.198.866 | US$ 175.469.669.184 |
| 2016 | US$ 63.039.926.529 | US$ 177.973.637.255 |
| 2015 | US$ 53.973.842.236 | US$ 177.596.632.553 |
| 2014 | US$ 50.411.846.512 | US$ 195.681.624.546 |
| 2013 | US$ 46.335.465.038 | US$ 180.200.033.350 |
| 2012 | US$ 50.588.475.477 | US$ 167.075.785.316 |
| 2011 | US$ 46.704.835.357 | US$ 149.208.113.907 |
| 2010 | US$ 31.871.836.373 | US$ 120.584.016.515 |
| 2009 | US$ 28.051.366.380 | US$ 99.888.815.494 |
| 2008 | US$ 20.288.388.624 | US$ 95.299.838.183 |
| 2007 | US$ 19.028.952.268 | US$ 87.208.175.923 |
| 2006 | US$ 19.339.948.067 | US$ 76.329.367.204 |
| 2005 | US$ 17.227.460.742 | US$ 74.109.703.346 |
| 2004 | US$ 19.758.627.233 | US$ 64.201.699.863 |
| 2003 | US$ 26.809.451.669 | US$ 59.026.700.311 |
| 2002 | US$ 40.303.470.181 | US$ 50.671.452.145 |
| 2001 | US$ 34.235.520.830 | US$ 44.804.667.773 |
| 2000 | US$ 35.607.623.345 | US$ 35.577.279.054 |
| 1999 | US$ 37.999.943.736 | US$ 31.828.401.325 |
| 1998 | US$ 60.881.358.763 | US$ 31.863.181.980 |
| 1997 | US$ 72.934.647.813 | US$ 28.852.477.361 |
| 1996 | US$ 63.699.008.717 | US$ 19.526.913.036 |
| 1995 | US$ 40.530.652.088 | US$ 17.045.558.633 |
| 1994 | US$ 47.531.541.940 | US$ 6.441.390.536 |
| 1993 | US$ 47.145.829.669 | US$ 25.298.703.698 |
| 1992 | US$ 50.708.513.479 | US$ 19.171.357.434 |
| 1991 | US$ 71.344.881.793 | US$ 18.052.066.982 |
| 1990 | US$ 57.238.070.968 | US$ 10.216.845.194 |
| 1989 | US$ 47.769.550.564 | US$ 6.740.245.011 |
| 1988 | US$ 42.835.075.929 | US$ 6.326.668.370 |
| 1987 | US$ 36.439.290.440 | US$ 13.691.985.454 |
| 1986 | US$ 20.548.059.804 | US$ 6.673.540.003 |
| 1985 | US$ 15.966.405.780 | US$ 5.678.880.167 |
| 1984 | US$ 16.464.821.365 | US$ 8.018.704.803 |
| 1983 | US$ 12.974.277.206 | US$ 4.793.446.679 |
| 1982 | US$ 14.328.182.502 | US$ 1.777.613.442 |
| 1981 | US$ 16.610.948.553 | US$ 4.971.260.746 |
| 1980 | US$ 20.473.495.450 | US$ 4.175.319.837 |
| 1979 | US$ 20.702.703.862 | US$ 3.087.692.135 |
| 1978 | US$ 13.394.127.225 | US$ 2.269.381.533 |
| 1977 | US$ 8.357.980.886 | US$ 1.938.338.555 |
| 1976 | US$ 6.626.926.078 | US$ 1.403.804.527 |
| 1975 | US$ 7.507.064.706 | US$ 1.896.784.593 |
| 1974 | US$ 8.535.016.961 | US$ 1.920.866.300 |
| 1973 | US$ 7.771.042.558 | US$ 1.679.817.085 |
| 1972 | US$ 5.397.172.464 | US$ 1.296.684.257 |
| 1971 | US$ 3.347.891.154 | US$ 981.458.345 |
| 1970 | US$ 1.851.302.470 | US$ 756.033.730 |
| 1969 | US$ 1.285.926.800 | US$ 663.370.800 |
| 1968 | US$ 1.303.543.700 | US$ 689.436.600 |
| 1967 | US$ 1.053.098.400 | US$ 586.953.600 |
| 1966 | US$ 1.210.578.030 | US$ 564.571.660 |
| 1965 | US$ 1.411.897.520 | US$ 538.031.680 |
| 1964 | US$ 1.515.235.680 | US$ 587.594.480 |
| 1963 | US$ 1.148.505.160 | US$ 548.302.680 |
| 1962 | US$ 1.045.887.990 | US$ 427.198.020 |
| 1961 | US$ 887.873.550 | US$ 413.480.000 |
| 1960 | US$ 544.061.600 | US$ 444.341.600 |
Em 2025, as reservas internacionais da Espanha foram de US$ 129 bilhões e as do México, de US$ 256 bilhões: as do México foram 2,0 vezes maiores. Em 1960, as reservas da Espanha foram 22% maiores: US$ 544 milhões da Espanha e US$ 444 milhões do México.
As reservas internacionais do México têm sido maiores que as da Espanha todos os anos desde 2001.
Espanha vs México: reservas, incluindo ouro, e meses de importações cobertos
|
Espanha
|
México
|
|
|---|---|---|
| Reservas, incluindo ouro | US$ 129 bi | US$ 256 bi |
| Meses de importações | 2,5 | 4,2 |
| Posição mundial | 23/168 | 17/168 |
| Diferença das reservas | 0,5× | 2× |
Comparar as reservas internacionais de 2 países quaisquer
Fontes:
- Banco Mundial | Economy & Growth (1960–2025, atualizado em outubro de 2026)
Creative Commons Atribuição (CC BY): você pode copiar, compartilhar, adaptar e reutilizar este conteúdo, inclusive para fins comerciais, desde que cite o statistics.wiki e indique as alterações que fizer. As fontes listadas acima podem ter suas próprias condições de licença.