
Somália vs Etiópia: reservas internacionais (incluindo ouro) por ano
1x
| Ano | US$ | |
|---|---|---|
 Somália |
 Etiópia |
|
| 2024 | - | US$ 3.784.387.425 |
| 2023 | - | US$ 2.028.214.255 |
| 2022 | - | US$ 1.191.712.941 |
| 2021 | - | US$ 1.644.005.887 |
| 2020 | - | US$ 3.046.114.359 |
| 2019 | - | US$ 2.992.704.275 |
| 2018 | - | US$ 3.987.464.166 |
| 2017 | - | US$ 3.045.571.315 |
| 2016 | - | US$ 3.030.943.951 |
| 2015 | - | US$ 3.835.287.576 |
| 2014 | - | US$ 3.525.244.981 |
| 2013 | - | US$ 2.363.513.607 |
| 2012 | - | US$ 2.301.655.548 |
| 2011 | - | US$ 2.837.310.958 |
| 2010 | - | US$ 2.241.164.556 |
| 2009 | - | US$ 1.780.874.214 |
| 2008 | - | US$ 870.502.510 |
| 2007 | - | US$ 1.289.865.496 |
| 2006 | - | US$ 867.438.394 |
| 2005 | - | US$ 1.042.595.212 |
| 2004 | - | US$ 1.496.784.362 |
| 2003 | - | US$ 955.608.348 |
| 2002 | - | US$ 965.896.480 |
| 2001 | - | US$ 489.895.095 |
| 2000 | - | US$ 362.554.237 |
| 1999 | - | US$ 546.583.394 |
| 1998 | - | US$ 598.411.583 |
| 1997 | - | US$ 588.431.598 |
| 1996 | - | US$ 843.310.624 |
| 1995 | - | US$ 815.019.143 |
| 1994 | - | US$ 587.541.811 |
| 1993 | - | US$ 499.938.564 |
| 1992 | - | US$ 270.054.786 |
| 1991 | - | US$ 106.436.547 |
| 1990 | - | US$ 55.191.078 |
| 1989 | US$ 23.109.679 | US$ 123.044.567 |
| 1988 | US$ 23.187.521 | US$ 149.969.164 |
| 1987 | US$ 16.607.371 | US$ 223.865.107 |
| 1986 | US$ 20.315.495 | US$ 332.198.100 |
| 1985 | US$ 8.786.945 | US$ 216.340.715 |
| 1984 | US$ 6.956.603 | US$ 108.775.329 |
| 1983 | US$ 16.476.673 | US$ 205.607.305 |
| 1982 | US$ 15.260.309 | US$ 277.333.075 |
| 1981 | US$ 38.252.037 | US$ 370.055.128 |
| 1980 | US$ 25.745.935 | US$ 262.284.692 |
| 1979 | US$ 51.380.005 | US$ 319.158.933 |
| 1978 | US$ 129.691.118 | US$ 217.562.056 |
| 1977 | US$ 121.754.091 | US$ 260.491.690 |
| 1976 | US$ 85.230.817 | US$ 331.791.559 |
| 1975 | US$ 68.737.413 | US$ 315.252.642 |
| 1974 | US$ 42.815.002 | US$ 314.837.566 |
| 1973 | US$ 35.333.861 | US$ 194.875.525 |
| 1972 | US$ 31.525.583 | US$ 99.364.693 |
| 1971 | US$ 26.190.338 | US$ 69.634.045 |
| 1970 | US$ 21.252.110 | US$ 71.745.620 |
| 1969 | US$ 14.229.600 | US$ 71.858.800 |
| 1968 | US$ 6.750.000 | US$ 67.958.900 |
| 1967 | US$ 10.000.000 | US$ 64.681.200 |
| 1966 | US$ 12.300.000 | US$ 78.676.090 |
| 1965 | US$ 8.600.000 | US$ 77.165.920 |
| 1964 | US$ 10.200.000 | US$ 61.174.240 |
| 1963 | US$ 18.770.000 | US$ 66.080.520 |
| 1962 | US$ 17.900.000 | US$ 65.001.370 |
| 1961 | US$ 16.500.000 | US$ 57.280.450 |
| 1960 | US$ 9.300.000 | US$ 55.049.600 |
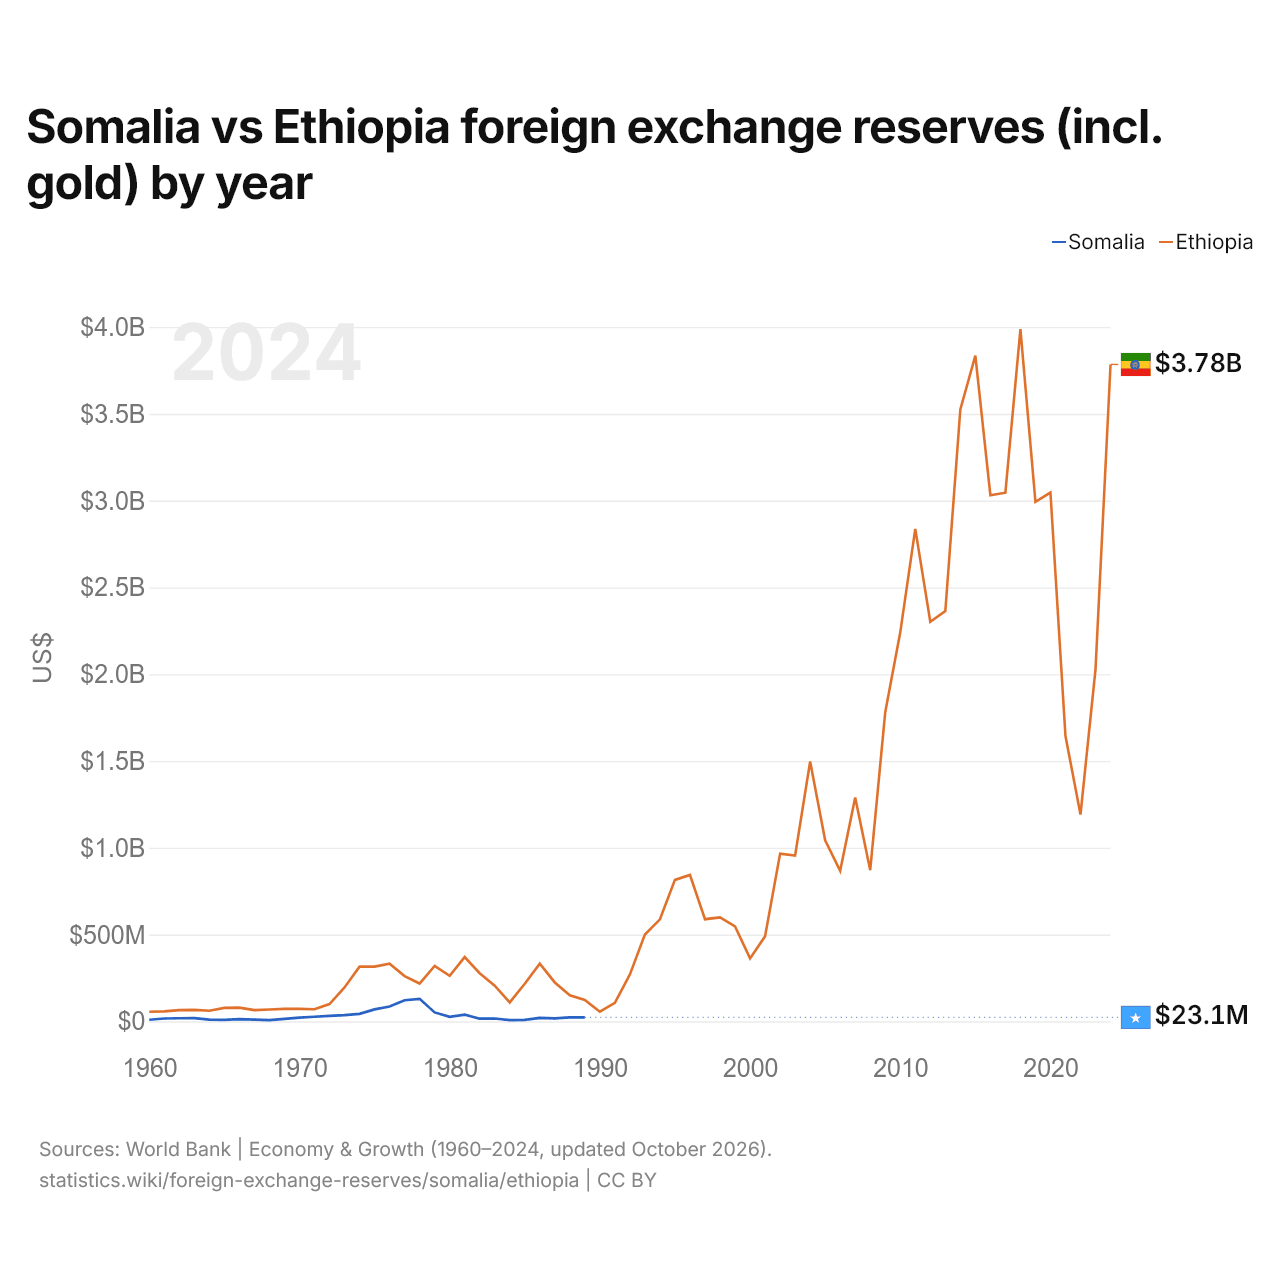
As reservas internacionais da Somália são de US$ 23,1 milhões (1989), e as da Etiópia, de US$ 3,78 bilhões (2024). Em 1960, as reservas da Etiópia foram 5,9 vezes maiores: US$ 9,3 milhões da Somália e US$ 55 milhões da Etiópia.
As reservas internacionais da Etiópia têm sido maiores que as da Somália todos os anos desde 1960.
Somália vs Etiópia: reservas, incluindo ouro, e meses de importações cobertos
|
Somália
|
Etiópia
|
|
|---|---|---|
| Reservas, incluindo ouro | US$ 23,1 mi (1989) | US$ 3,78 bi (2024) |
| Meses de importações | 0,6 (1989) | 2,6 (2024) |
| Posição mundial | Sem classificação | 109/168 |
Comparar as reservas internacionais de 2 países quaisquer
Fontes:
- Banco Mundial | Economy & Growth (1960–2024, atualizado em outubro de 2026)
Creative Commons Atribuição (CC BY): você pode copiar, compartilhar, adaptar e reutilizar este conteúdo, inclusive para fins comerciais, desde que cite o statistics.wiki e indique as alterações que fizer. As fontes listadas acima podem ter suas próprias condições de licença.