
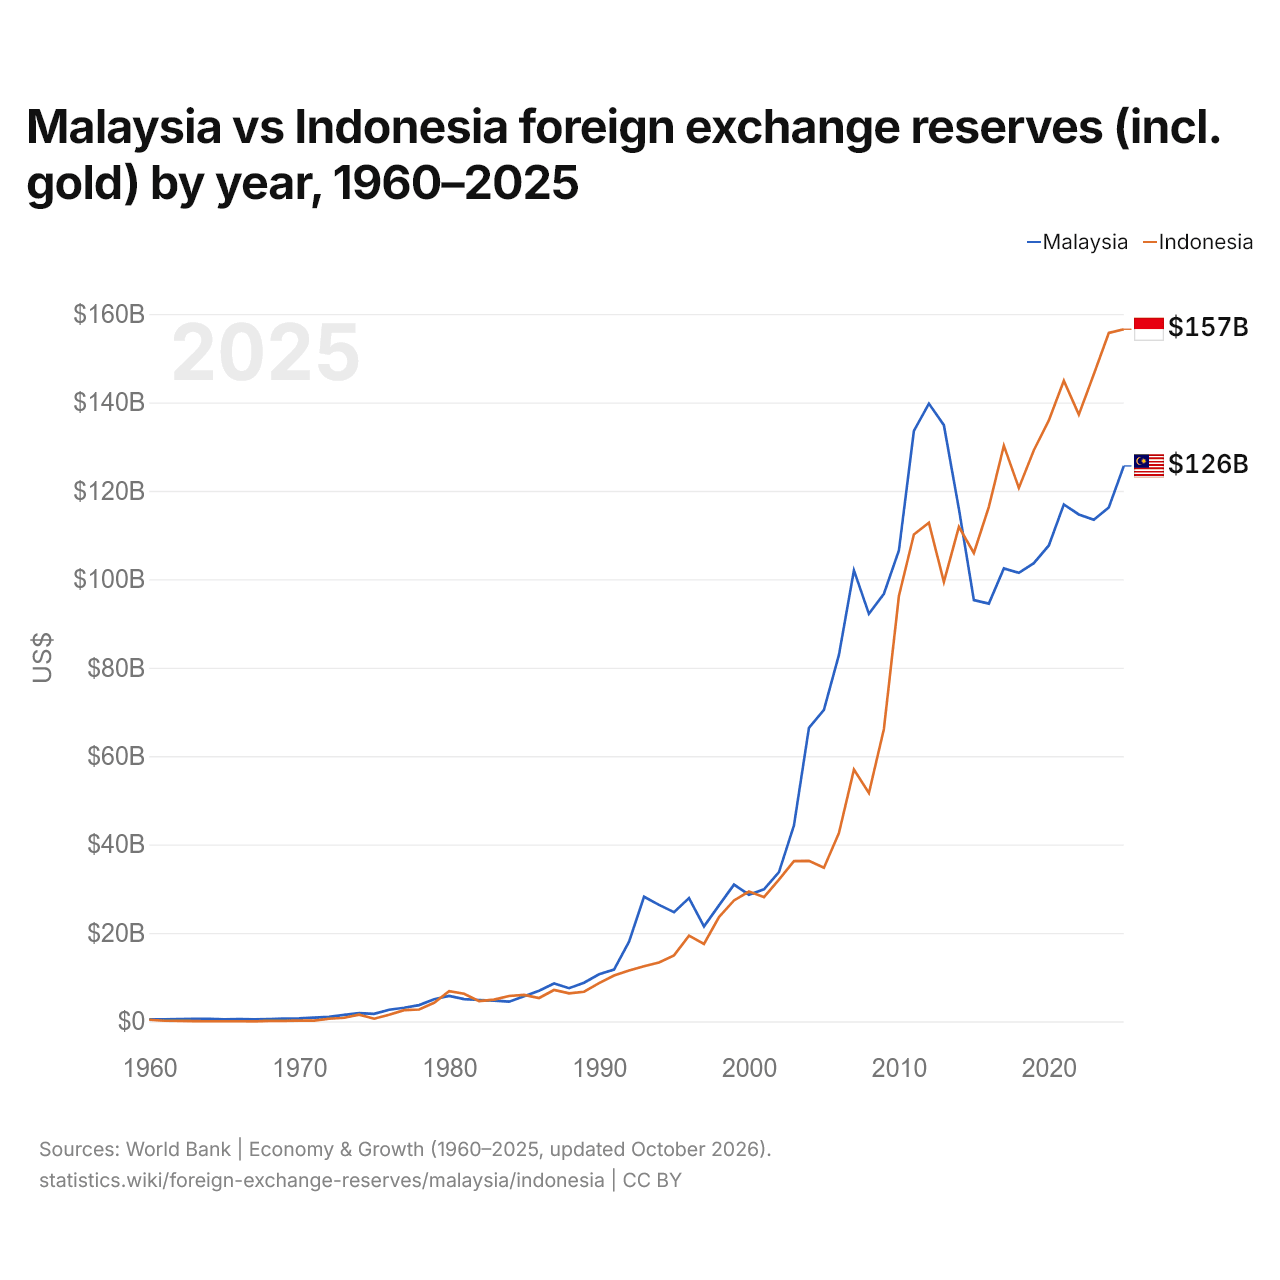
Malásia vs Indonésia: reservas internacionais (incluindo ouro) por ano, 1960–2025
1x
| Ano | US$ | |
|---|---|---|
 Malásia |
 Indonésia |
|
| 2025 | US$ 125.629.250.346 | US$ 156.542.507.870 |
| 2024 | US$ 116.229.205.258 | US$ 155.708.275.548 |
| 2023 | US$ 113.462.632.024 | US$ 146.358.992.702 |
| 2022 | US$ 114.658.812.345 | US$ 137.222.356.128 |
| 2021 | US$ 116.915.867.600 | US$ 144.907.809.744 |
| 2020 | US$ 107.643.865.229 | US$ 135.915.917.616 |
| 2019 | US$ 103.629.721.169 | US$ 129.186.464.020 |
| 2018 | US$ 101.452.531.755 | US$ 120.660.974.091 |
| 2017 | US$ 102.446.599.681 | US$ 130.215.330.383 |
| 2016 | US$ 94.481.267.074 | US$ 116.369.601.851 |
| 2015 | US$ 95.282.342.268 | US$ 105.928.847.089 |
| 2014 | US$ 115.958.875.076 | US$ 111.862.594.562 |
| 2013 | US$ 134.853.702.252 | US$ 99.386.826.239 |
| 2012 | US$ 139.730.782.666 | US$ 112.797.627.833 |
| 2011 | US$ 133.571.684.232 | US$ 110.136.597.662 |
| 2010 | US$ 106.528.123.470 | US$ 96.210.980.584 |
| 2009 | US$ 96.704.054.215 | US$ 66.118.917.968 |
| 2008 | US$ 92.166.457.065 | US$ 51.640.625.721 |
| 2007 | US$ 101.994.768.945 | US$ 56.935.744.023 |
| 2006 | US$ 82.876.090.883 | US$ 42.597.040.282 |
| 2005 | US$ 70.458.190.075 | US$ 34.730.799.049 |
| 2004 | US$ 66.393.546.884 | US$ 36.310.733.909 |
| 2003 | US$ 44.309.888.491 | US$ 36.256.203.642 |
| 2002 | US$ 33.761.683.388 | US$ 32.033.585.247 |
| 2001 | US$ 29.845.803.174 | US$ 28.103.636.180 |
| 2000 | US$ 28.650.936.564 | US$ 29.352.929.561 |
| 1999 | US$ 30.930.646.966 | US$ 27.345.097.667 |
| 1998 | US$ 26.235.700.001 | US$ 23.605.842.946 |
| 1997 | US$ 21.470.190.358 | US$ 17.486.799.643 |
| 1996 | US$ 27.891.908.787 | US$ 19.396.148.967 |
| 1995 | US$ 24.698.750.841 | US$ 14.907.558.866 |
| 1994 | US$ 26.338.865.721 | US$ 13.321.136.813 |
| 1993 | US$ 28.182.868.224 | US$ 12.474.062.371 |
| 1992 | US$ 18.023.989.163 | US$ 11.482.019.253 |
| 1991 | US$ 11.716.563.985 | US$ 10.357.989.011 |
| 1990 | US$ 10.658.831.703 | US$ 8.656.792.855 |
| 1989 | US$ 8.733.335.043 | US$ 6.699.438.101 |
| 1988 | US$ 7.490.586.592 | US$ 6.321.735.767 |
| 1987 | US$ 8.572.963.846 | US$ 7.094.971.197 |
| 1986 | US$ 6.942.091.429 | US$ 5.264.622.148 |
| 1985 | US$ 5.677.019.192 | US$ 5.989.249.388 |
| 1984 | US$ 4.441.615.351 | US$ 5.729.969.488 |
| 1983 | US$ 4.672.616.248 | US$ 4.902.569.211 |
| 1982 | US$ 4.832.354.978 | US$ 4.562.680.198 |
| 1981 | US$ 5.024.212.852 | US$ 6.248.009.714 |
| 1980 | US$ 5.754.999.182 | US$ 6.802.959.429 |
| 1979 | US$ 5.005.509.362 | US$ 4.205.180.825 |
| 1978 | US$ 3.670.453.192 | US$ 2.676.740.697 |
| 1977 | US$ 3.070.865.971 | US$ 2.536.611.976 |
| 1976 | US$ 2.627.815.149 | US$ 1.504.197.786 |
| 1975 | US$ 1.688.955.830 | US$ 592.327.932 |
| 1974 | US$ 1.856.664.245 | US$ 1.500.130.951 |
| 1973 | US$ 1.461.558.717 | US$ 811.133.005 |
| 1972 | US$ 1.014.857.175 | US$ 580.054.154 |
| 1971 | US$ 827.084.342 | US$ 145.119.482 |
| 1970 | US$ 667.456.900 | US$ 160.280.180 |
| 1969 | US$ 619.980.000 | US$ 121.712.800 |
| 1968 | US$ 529.201.000 | US$ 87.276.600 |
| 1967 | US$ 457.018.000 | US$ 6.012.800 |
| 1966 | US$ 494.285.700 | US$ 23.011.660 |
| 1965 | US$ 469.857.200 | US$ 21.003.680 |
| 1964 | US$ 593.424.000 | US$ 25.003.680 |
| 1963 | US$ 555.268.400 | US$ 58.079.560 |
| 1962 | US$ 531.546.300 | US$ 108.100.020 |
| 1961 | US$ 472.000.000 | US$ 133.183.550 |
| 1960 | US$ 471.000.000 | US$ 352.739.200 |
Em 2025, as reservas internacionais da Malásia foram de US$ 126 bilhões e as da Indonésia, de US$ 157 bilhões: as da Indonésia foram 25% maiores. Em 1960, as reservas da Malásia foram 34% maiores: US$ 471 milhões da Malásia e US$ 353 milhões da Indonésia.
As reservas internacionais da Indonésia têm sido maiores que as da Malásia todos os anos desde 2015.
Malásia vs Indonésia: reservas, incluindo ouro, e meses de importações cobertos
|
Malásia
|
Indonésia
|
|
|---|---|---|
| Reservas, incluindo ouro | US$ 126 bi | US$ 157 bi |
| Meses de importações | 4,9 | 6,3 |
| Posição mundial | 25/168 | 22/168 |
| Diferença das reservas | 0,8× | 1,2× |
Comparar as reservas internacionais de 2 países quaisquer
Fontes:
- Banco Mundial | Economy & Growth (1960–2025, atualizado em outubro de 2026)
Creative Commons Atribuição (CC BY): você pode copiar, compartilhar, adaptar e reutilizar este conteúdo, inclusive para fins comerciais, desde que cite o statistics.wiki e indique as alterações que fizer. As fontes listadas acima podem ter suas próprias condições de licença.