
Barbados vs Antígua e Barbuda: reservas internacionais (incluindo ouro) por ano, 1966–2025
1x
| Ano | US$ | |
|---|---|---|
 Barbados |
 Antígua e Barbuda |
|
| 2025 | - | US$ 378.519.316 |
| 2024 | US$ 1.653.675.115 | US$ 358.440.632 |
| 2023 | US$ 1.605.919.491 | US$ 364.367.020 |
| 2022 | US$ 1.519.660.180 | US$ 396.505.746 |
| 2021 | US$ 1.672.884.485 | US$ 367.511.736 |
| 2020 | US$ 1.358.013.876 | US$ 221.808.946 |
| 2019 | US$ 772.118.650 | US$ 279.133.213 |
| 2018 | US$ 533.906.813 | US$ 328.659.748 |
| 2017 | US$ 265.841.633 | US$ 313.645.371 |
| 2016 | US$ 431.758.242 | US$ 330.090.979 |
| 2015 | US$ 553.604.324 | US$ 355.728.253 |
| 2014 | US$ 632.258.680 | US$ 297.046.138 |
| 2013 | US$ 680.957.827 | US$ 202.580.587 |
| 2012 | US$ 839.722.748 | US$ 162.045.102 |
| 2011 | US$ 812.596.876 | US$ 147.868.734 |
| 2010 | US$ 833.540.950 | US$ 136.600.155 |
| 2009 | US$ 871.145.394 | US$ 127.860.399 |
| 2008 | US$ 738.527.015 | US$ 138.022.503 |
| 2007 | US$ 839.429.793 | US$ 143.848.809 |
| 2006 | US$ 636.089.800 | US$ 142.632.589 |
| 2005 | US$ 603.465.289 | US$ 127.320.746 |
| 2004 | US$ 579.857.104 | US$ 120.139.162 |
| 2003 | US$ 737.943.173 | US$ 113.767.367 |
| 2002 | US$ 668.514.869 | US$ 87.648.341 |
| 2001 | US$ 690.373.664 | US$ 79.718.831 |
| 2000 | US$ 472.693.479 | US$ 63.558.885 |
| 1999 | US$ 301.944.451 | US$ 69.730.256 |
| 1998 | US$ 365.945.246 | US$ 59.367.608 |
| 1997 | US$ 264.917.583 | US$ 50.698.392 |
| 1996 | US$ 289.685.886 | US$ 47.738.677 |
| 1995 | US$ 219.099.891 | US$ 59.438.706 |
| 1994 | US$ 195.765.860 | US$ 45.808.258 |
| 1993 | US$ 150.453.017 | US$ 37.806.868 |
| 1992 | US$ 139.962.501 | US$ 50.520.000 |
| 1991 | US$ 87.245.215 | US$ 32.540.000 |
| 1990 | US$ 117.535.619 | US$ 27.500.000 |
| 1989 | US$ 111.894.938 | US$ 28.070.000 |
| 1988 | US$ 137.948.752 | US$ 28.030.000 |
| 1987 | US$ 148.145.897 | US$ 25.600.000 |
| 1986 | US$ 154.080.959 | US$ 28.260.000 |
| 1985 | US$ 141.755.188 | US$ 16.580.000 |
| 1984 | US$ 134.385.155 | US$ 15.440.000 |
| 1983 | US$ 125.586.463 | US$ 9.930.000 |
| 1982 | US$ 124.370.269 | US$ 8.520.000 |
| 1981 | US$ 102.966.358 | US$ 7.336.296 |
| 1980 | US$ 80.572.815 | US$ 7.816.667 |
| 1979 | US$ 66.117.379 | US$ 11.232.963 |
| 1978 | US$ 59.836.293 | US$ 5.973.333 |
| 1977 | US$ 37.006.128 | US$ 5.103.704 |
| 1976 | US$ 27.977.462 | US$ 9.665.926 |
| 1975 | US$ 39.579.071 | US$ 7.315.757 |
| 1974 | US$ 39.152.392 | - |
| 1973 | US$ 32.374.267 | - |
| 1972 | US$ 27.988.872 | - |
| 1971 | US$ 18.860.582 | - |
| 1970 | US$ 16.580.000 | - |
| 1969 | US$ 12.470.000 | - |
| 1968 | US$ 15.520.000 | - |
| 1967 | US$ 9.250.000 | - |
| 1966 | US$ 12.110.000 | - |
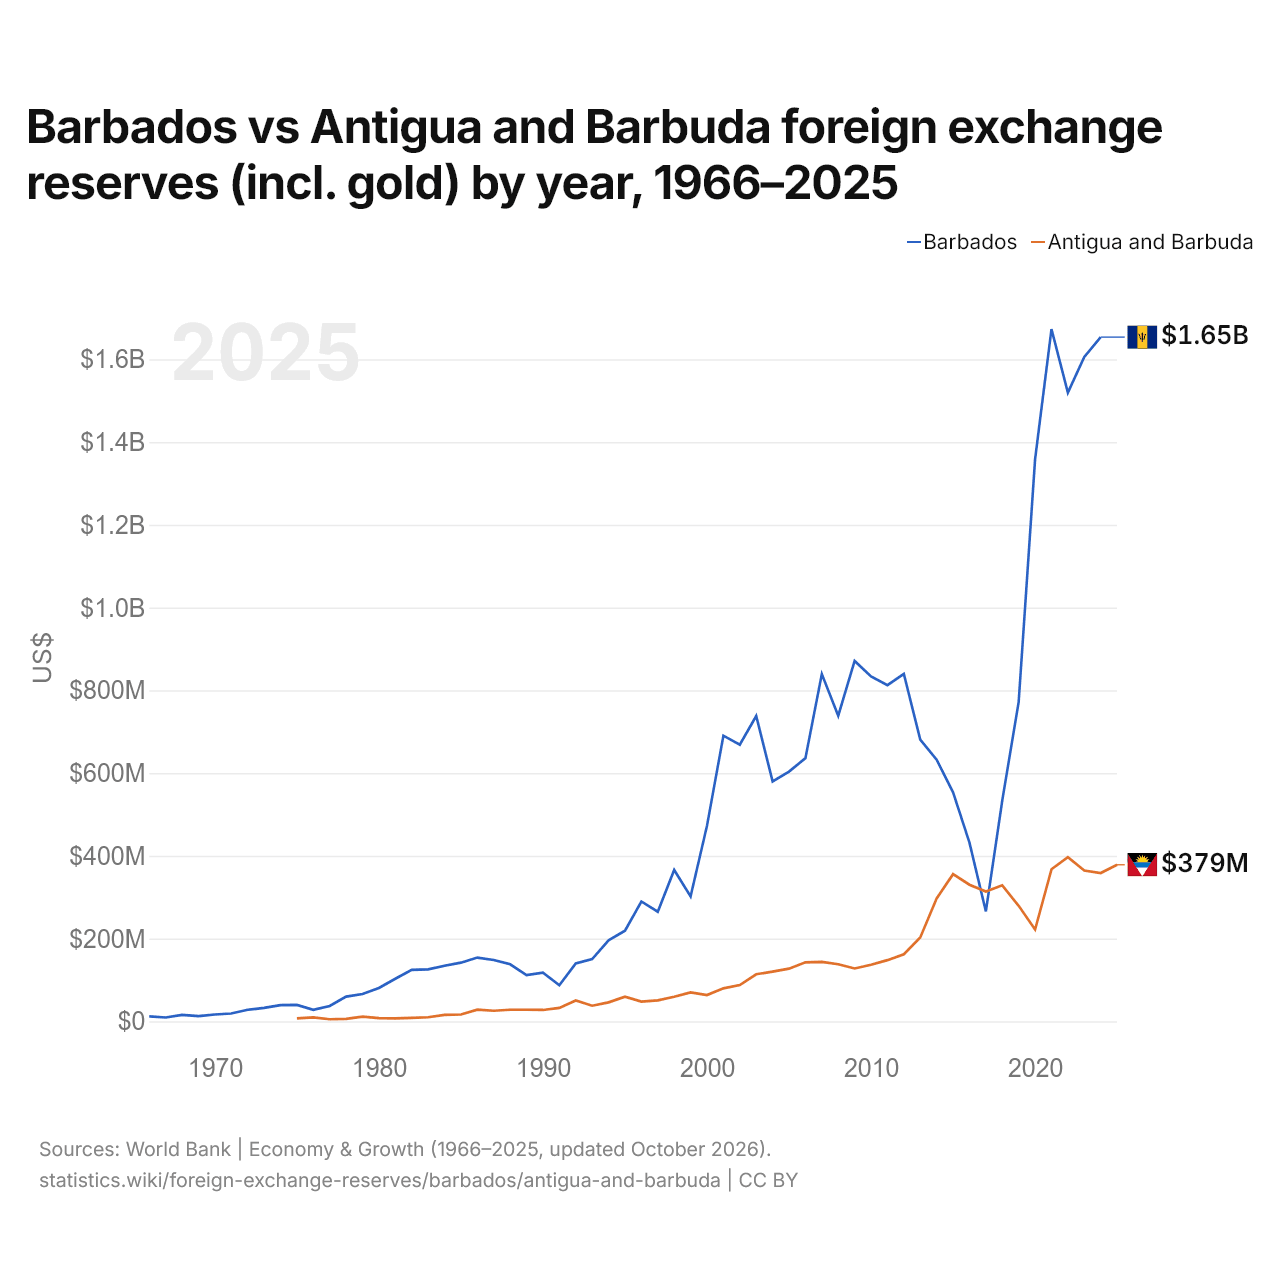
As reservas internacionais de Barbados foram de US$ 1,65 bilhão (2024) e as de Antígua e Barbuda, de US$ 358 milhões (2024): as de Barbados foram 4,6 vezes maiores. Em 1975, as reservas de Barbados foram 5,4 vezes maiores: US$ 39,6 milhões de Barbados e US$ 7,32 milhões de Antígua e Barbuda.
As reservas internacionais de Barbados têm sido maiores que as de Antígua e Barbuda todos os anos desde 2018.
Barbados vs Antígua e Barbuda: reservas, incluindo ouro, e meses de importações cobertos
|
Barbados
|
Antígua e Barbuda
|
|
|---|---|---|
| Reservas, incluindo ouro | US$ 1,65 bi (2024) | US$ 379 mi (2025) |
| Meses de importações | n/d | 4,0 (2022) |
| Posição mundial | 127/168 | 160/168 |
Comparar as reservas internacionais de 2 países quaisquer
Fontes:
- Banco Mundial | Economy & Growth (1966–2025, atualizado em outubro de 2026)
Creative Commons Atribuição (CC BY): você pode copiar, compartilhar, adaptar e reutilizar este conteúdo, inclusive para fins comerciais, desde que cite o statistics.wiki e indique as alterações que fizer. As fontes listadas acima podem ter suas próprias condições de licença.