
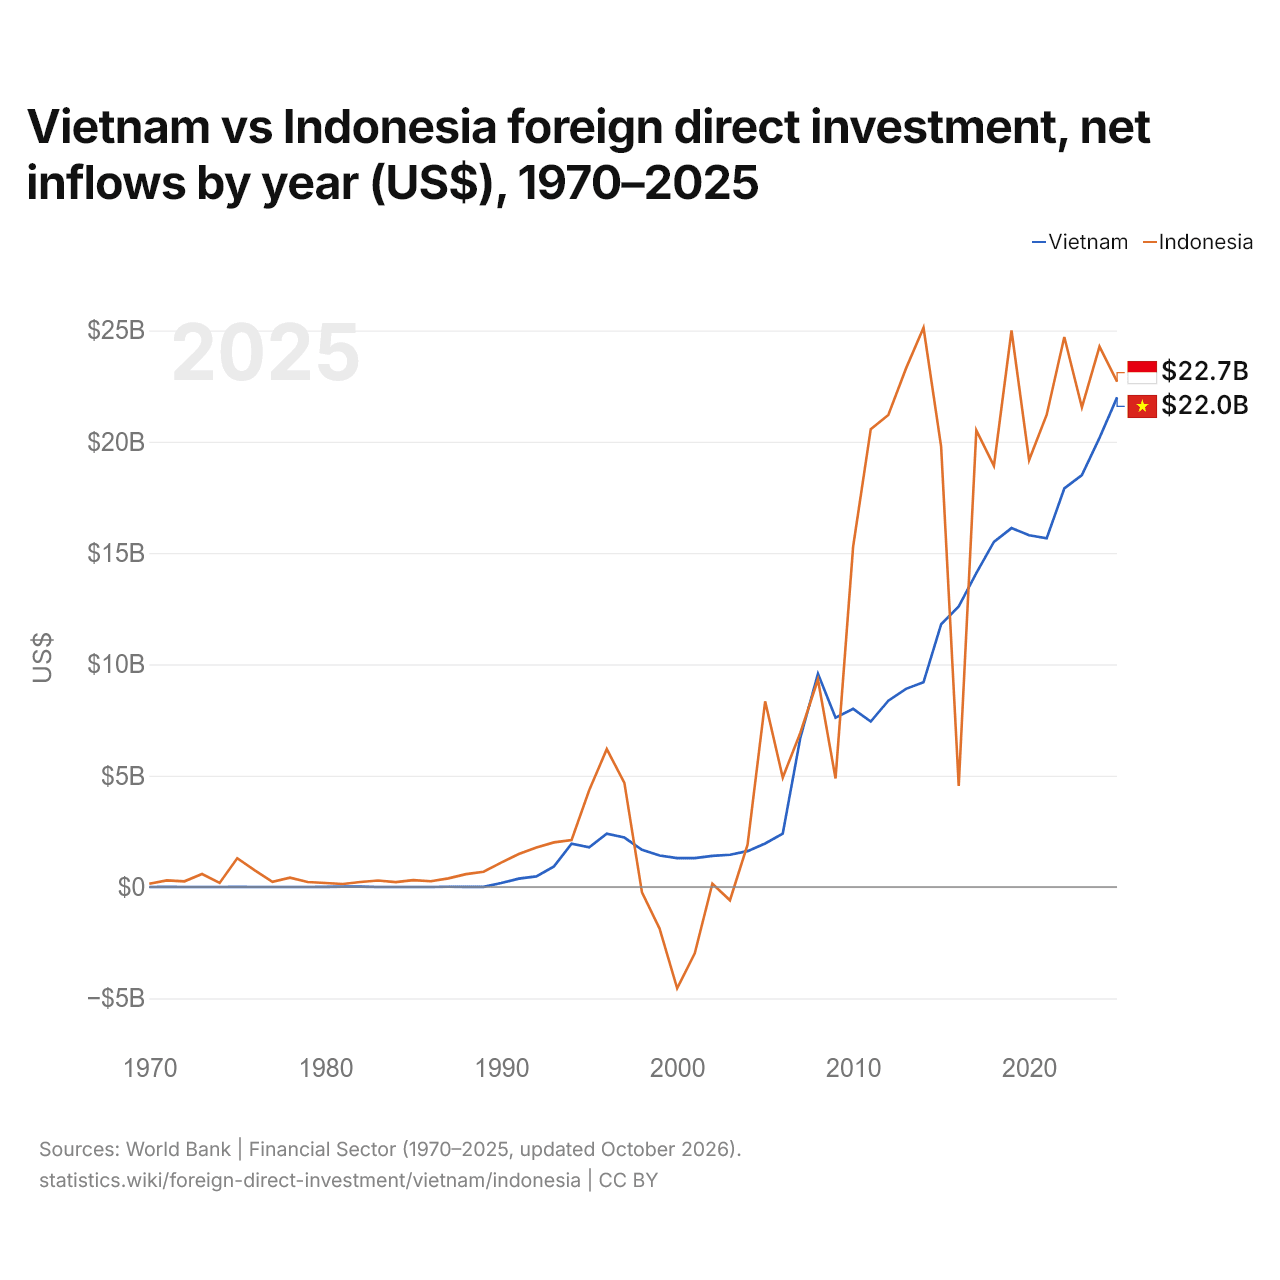
Vietnã vs Indonésia: investimento estrangeiro direto, entradas líquidas por ano (US$), 1970–2025
1x
| Ano | US$ | |
|---|---|---|
 Vietnã |
 Indonésia |
|
| 2025 | US$ 21.990.000.000 | US$ 22.698.158.405 |
| 2024 | US$ 20.170.000.000 | US$ 24.275.445.280 |
| 2023 | US$ 18.500.000.000 | US$ 21.543.358.781 |
| 2022 | US$ 17.900.000.000 | US$ 24.702.029.705 |
| 2021 | US$ 15.660.000.000 | US$ 21.213.080.330 |
| 2020 | US$ 15.800.000.000 | US$ 19.175.077.748 |
| 2019 | US$ 16.120.000.000 | US$ 24.993.551.748 |
| 2018 | US$ 15.500.000.000 | US$ 18.909.826.044 |
| 2017 | US$ 14.100.000.000 | US$ 20.510.310.832 |
| 2016 | US$ 12.600.000.000 | US$ 4.541.713.739 |
| 2015 | US$ 11.800.000.000 | US$ 19.779.127.977 |
| 2014 | US$ 9.200.000.000 | US$ 25.120.732.060 |
| 2013 | US$ 8.900.000.000 | US$ 23.281.742.362 |
| 2012 | US$ 8.368.000.000 | US$ 21.200.778.608 |
| 2011 | US$ 7.430.000.000 | US$ 20.564.938.227 |
| 2010 | US$ 8.000.000.000 | US$ 15.292.009.411 |
| 2009 | US$ 7.600.000.000 | US$ 4.877.369.178 |
| 2008 | US$ 9.579.000.000 | US$ 9.318.453.650 |
| 2007 | US$ 6.700.000.000 | US$ 6.928.480.000 |
| 2006 | US$ 2.400.000.000 | US$ 4.914.201.435 |
| 2005 | US$ 1.954.000.000 | US$ 8.336.257.208 |
| 2004 | US$ 1.610.000.000 | US$ 1.896.082.770 |
| 2003 | US$ 1.450.000.000 | US$ −596.923.828 |
| 2002 | US$ 1.400.000.000 | US$ 145.085.549 |
| 2001 | US$ 1.300.000.000 | US$ −2.977.391.857 |
| 2000 | US$ 1.298.000.000 | US$ −4.550.355.286 |
| 1999 | US$ 1.412.000.000 | US$ −1.865.620.963 |
| 1998 | US$ 1.671.000.000 | US$ −240.800.000 |
| 1997 | US$ 2.220.000.000 | US$ 4.677.000.000 |
| 1996 | US$ 2.395.000.000 | US$ 6.194.000.000 |
| 1995 | US$ 1.780.400.000 | US$ 4.346.000.000 |
| 1994 | US$ 1.944.515.936 | US$ 2.109.000.000 |
| 1993 | US$ 926.303.715 | US$ 2.004.000.000 |
| 1992 | US$ 473.945.856 | US$ 1.777.000.000 |
| 1991 | US$ 375.190.278 | US$ 1.482.000.000 |
| 1990 | US$ 180.000.000 | US$ 1.093.000.000 |
| 1989 | US$ 4.070.000 | US$ 682.000.000 |
| 1988 | US$ 7.680.000 | US$ 576.000.000 |
| 1987 | US$ 10.363.704 | US$ 385.000.000 |
| 1986 | US$ 40.000 | US$ 258.000.000 |
| 1985 | US$ −80.000 | US$ 310.000.000 |
| 1984 | US$ 690.000 | US$ 222.000.000 |
| 1983 | US$ 131.111 | US$ 292.000.000 |
| 1982 | US$ 13.050.000 | US$ 225.000.000 |
| 1981 | US$ 17.910.000 | US$ 133.000.000 |
| 1980 | US$ 1.666.667 | US$ 180.000.000 |
| 1979 | US$ −60.000 | US$ 226.000.000 |
| 1978 | US$ 463.333 | US$ 417.710.000 |
| 1977 | US$ −10.000 | US$ 235.000.000 |
| 1976 | US$ −340.000 | US$ 747.590.000 |
| 1975 | US$ 4.090.000 | US$ 1.292.060.000 |
| 1974 | US$ 1.250.000 | US$ 182.120.000 |
| 1973 | US$ 1.030.000 | US$ 581.000.000 |
| 1972 | US$ −890.000 | US$ 253.520.000 |
| 1971 | US$ 1.820.000 | US$ 299.070.000 |
| 1970 | US$ 70.000 | US$ 145.380.000 |
Em 2025, as entradas líquidas de investimento estrangeiro direto foram de US$ 22 bilhões no Vietnã e de US$ 22,7 bilhões na Indonésia: 3,2% a mais na Indonésia. Em 1970, foram de US$ 70.000 no Vietnã e de US$ 145 milhões na Indonésia.
As entradas líquidas de investimento estrangeiro direto no Vietnã foram maiores que na Indonésia em 9 dos 56 anos de 1970 a 2025, e menores em 47.
Vietnã vs Indonésia: entradas e saídas mais recentes de investimento estrangeiro
|
Vietnã
|
Indonésia
|
|
|---|---|---|
| Entradas líquidas | +US$ 22,0 bi | +US$ 22,7 bi |
| Entradas líquidas, % do PIB | +4,3% | +1,6% |
| Saídas líquidas | +US$ 700 mi | +US$ 8,15 bi |
| Entradas líquidas, total 2016–2025 | +US$ 168 bi | +US$ 203 bi |
| Posição mundial | 20/192 | 19/192 |
Comparar o investimento estrangeiro direto de 2 países quaisquer
Fontes:
- Banco Mundial | Financial Sector (1970–2025, atualizado em outubro de 2026)
Creative Commons Atribuição (CC BY): você pode copiar, compartilhar, adaptar e reutilizar este conteúdo, inclusive para fins comerciais, desde que cite o statistics.wiki e indique as alterações que fizer. As fontes listadas acima podem ter suas próprias condições de licença.