
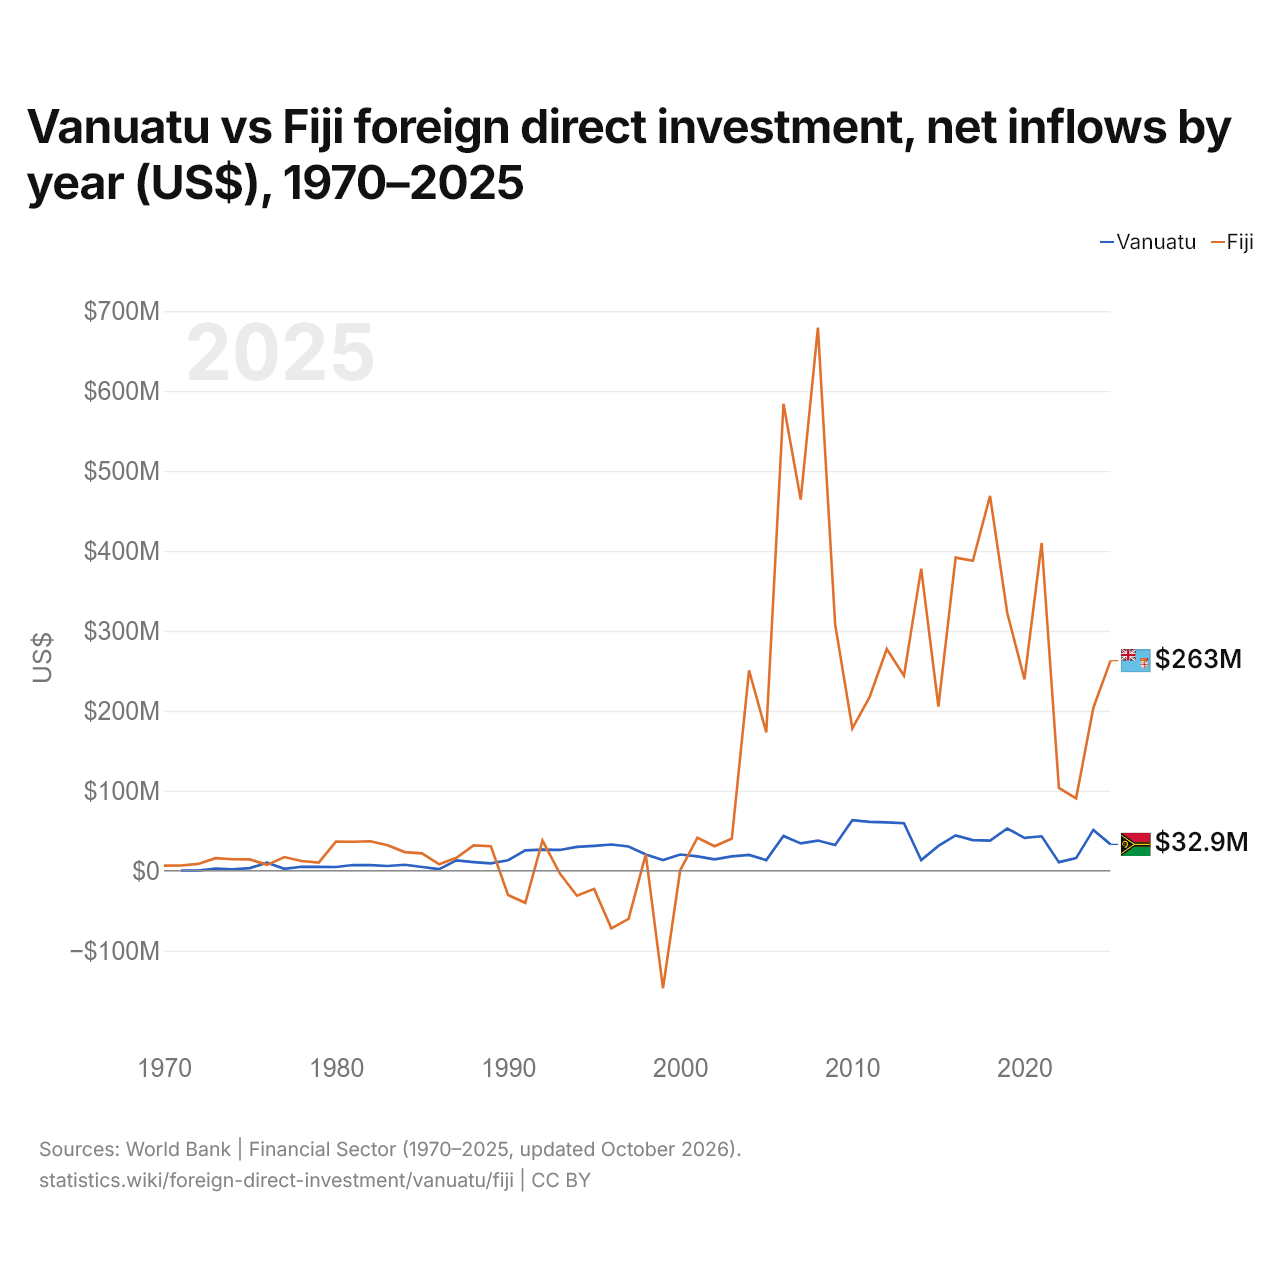
Vanuatu vs Fiji: investimento estrangeiro direto, entradas líquidas por ano (US$), 1970–2025
1x
| Ano | US$ | |
|---|---|---|
 Vanuatu |
 Fiji |
|
| 2025 | US$ 32.918.506 | US$ 262.762.648 |
| 2024 | US$ 51.072.043 | US$ 203.609.191 |
| 2023 | US$ 15.724.630 | US$ 90.569.883 |
| 2022 | US$ 10.694.983 | US$ 103.581.592 |
| 2021 | US$ 43.055.519 | US$ 409.894.560 |
| 2020 | US$ 41.158.956 | US$ 239.380.738 |
| 2019 | US$ 52.849.932 | US$ 322.282.826 |
| 2018 | US$ 37.583.468 | US$ 468.861.003 |
| 2017 | US$ 38.222.690 | US$ 387.602.565 |
| 2016 | US$ 44.178.569 | US$ 391.619.655 |
| 2015 | US$ 31.021.246 | US$ 205.373.209 |
| 2014 | US$ 13.266.164 | US$ 377.869.372 |
| 2013 | US$ 59.379.213 | US$ 243.782.754 |
| 2012 | US$ 60.388.540 | US$ 277.313.672 |
| 2011 | US$ 61.117.731 | US$ 217.158.526 |
| 2010 | US$ 63.109.399 | US$ 178.091.736 |
| 2009 | US$ 32.140.846 | US$ 308.373.711 |
| 2008 | US$ 37.694.497 | US$ 679.220.489 |
| 2007 | US$ 34.155.235 | US$ 464.230.334 |
| 2006 | US$ 43.447.012 | US$ 583.975.309 |
| 2005 | US$ 13.251.642 | US$ 172.951.929 |
| 2004 | US$ 19.840.844 | US$ 250.597.673 |
| 2003 | US$ 18.010.732 | US$ 40.310.495 |
| 2002 | US$ 14.162.545 | US$ 30.672.578 |
| 2001 | US$ 18.004.322 | US$ 41.301.896 |
| 2000 | US$ 20.256.090 | US$ 591.375 |
| 1999 | US$ 13.403.367 | US$ −147.083.836 |
| 1998 | US$ 20.383.379 | US$ 20.334.035 |
| 1997 | US$ 30.233.300 | US$ −60.193.603 |
| 1996 | US$ 32.732.116 | US$ −72.186.988 |
| 1995 | US$ 31.044.915 | US$ −22.683.100 |
| 1994 | US$ 29.786.176 | US$ −31.281.482 |
| 1993 | US$ 25.967.921 | US$ −3.243.015 |
| 1992 | US$ 26.452.894 | US$ 37.791.315 |
| 1991 | US$ 25.474.518 | US$ −40.188.200 |
| 1990 | US$ 13.111.197 | US$ −30.386.756 |
| 1989 | US$ 9.168.584 | US$ 30.606.742 |
| 1988 | US$ 10.813.577 | US$ 31.602.682 |
| 1987 | US$ 12.893.062 | US$ 16.159.397 |
| 1986 | US$ 2.017.425 | US$ 8.032.725 |
| 1985 | US$ 4.625.776 | US$ 21.672.151 |
| 1984 | US$ 7.437.906 | US$ 23.314.315 |
| 1983 | US$ 5.867.100 | US$ 31.946.264 |
| 1982 | US$ 6.932.931 | US$ 36.827.765 |
| 1981 | US$ 7.121.000 | US$ 36.249.750 |
| 1980 | US$ 4.635.500 | US$ 36.334.088 |
| 1979 | US$ 4.890.000 | US$ 10.170.588 |
| 1978 | US$ 4.920.000 | US$ 12.190.000 |
| 1977 | US$ 2.350.000 | US$ 17.100.000 |
| 1976 | US$ 10.100.000 | US$ 7.330.000 |
| 1975 | US$ 3.250.000 | US$ 14.100.000 |
| 1974 | US$ 1.790.000 | US$ 14.300.000 |
| 1973 | US$ 2.800.000 | US$ 15.700.000 |
| 1972 | US$ 40.000 | US$ 8.500.000 |
| 1971 | US$ 10.000 | US$ 6.500.000 |
| 1970 | - | US$ 6.400.000 |
Em 2025, as entradas líquidas de investimento estrangeiro direto foram de US$ 32,9 milhões em Vanuatu e de US$ 263 milhões em Fiji: 8,0 vezes mais em Fiji. Em 1971, foram de US$ 10.000 em Vanuatu e de US$ 6,5 milhões em Fiji.
As entradas líquidas de investimento estrangeiro direto em Vanuatu foram maiores que em Fiji em 11 dos 55 anos de 1971 a 2025, e menores em 44.
Vanuatu vs Fiji: entradas e saídas mais recentes de investimento estrangeiro
|
Vanuatu
|
Fiji
|
|
|---|---|---|
| Entradas líquidas | +US$ 32,9 mi | +US$ 263 mi |
| Entradas líquidas, % do PIB | +2,4% | +4,2% |
| Saídas líquidas | +US$ 2,75 mi | +US$ 43,1 mi |
| Entradas líquidas, total 2016–2025 | +US$ 367 mi | +US$ 2,88 bi |
| Posição mundial | 161/192 | 132/192 |
Comparar o investimento estrangeiro direto de 2 países quaisquer
Fontes:
- Banco Mundial | Financial Sector (1970–2025, atualizado em outubro de 2026)
Creative Commons Atribuição (CC BY): você pode copiar, compartilhar, adaptar e reutilizar este conteúdo, inclusive para fins comerciais, desde que cite o statistics.wiki e indique as alterações que fizer. As fontes listadas acima podem ter suas próprias condições de licença.