
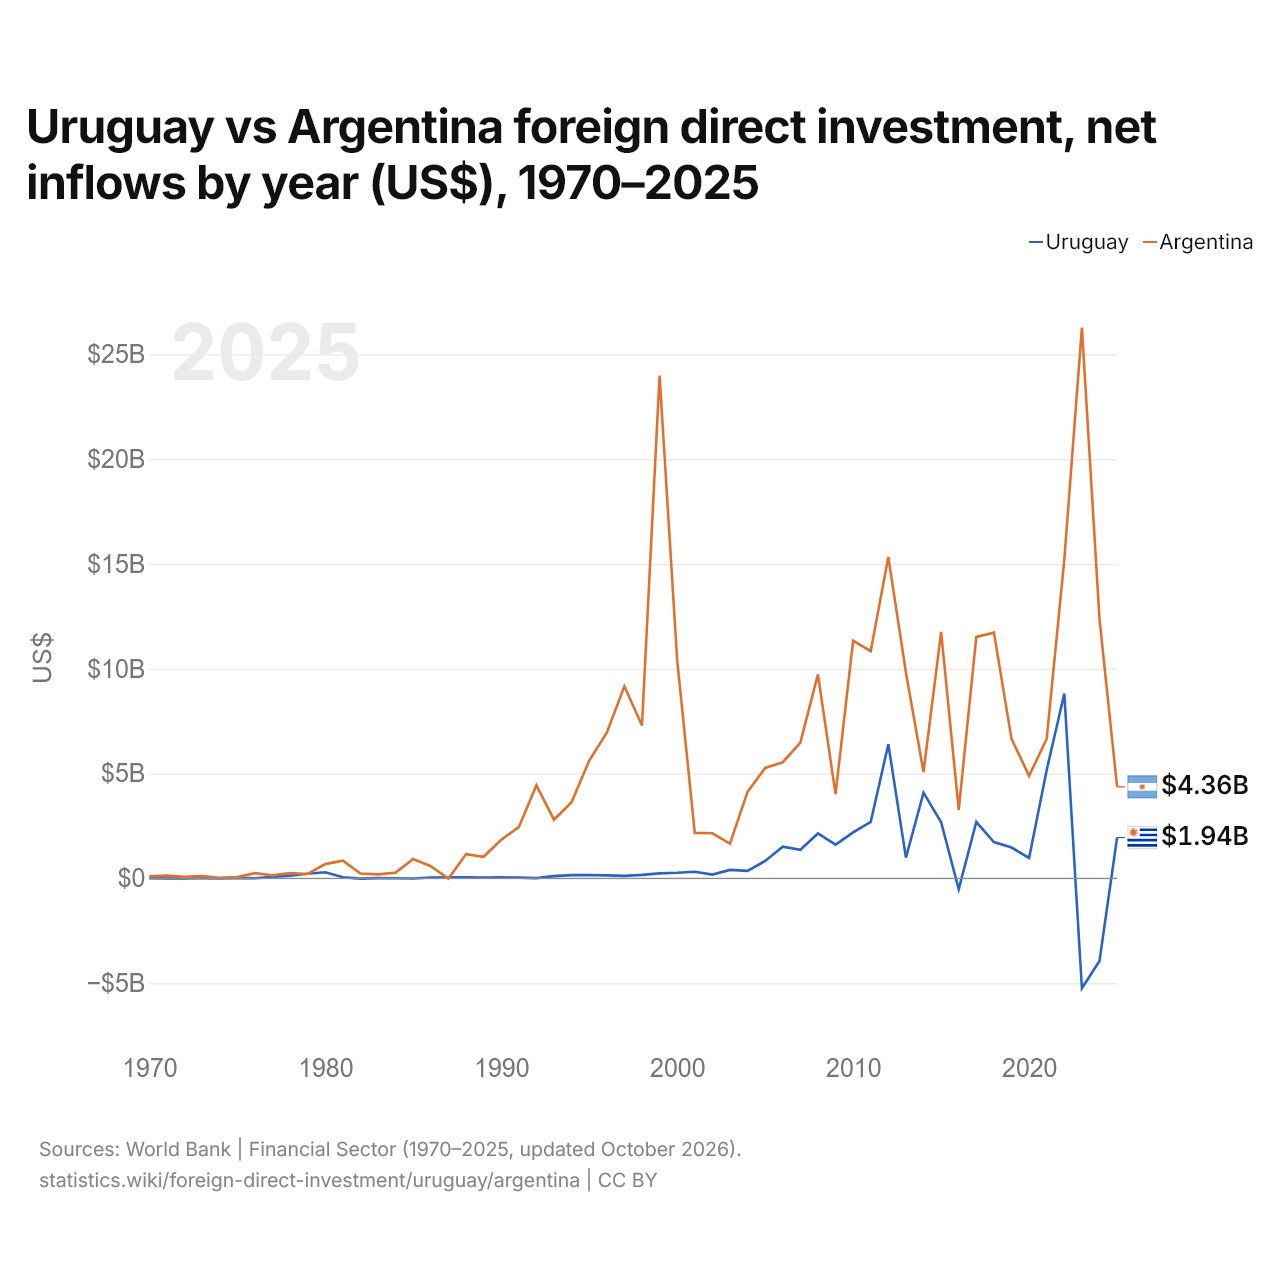
Uruguai vs Argentina: investimento estrangeiro direto, entradas líquidas por ano (US$), 1970–2025
1x
| Ano | US$ | |
|---|---|---|
 Uruguai |
 Argentina |
|
| 2025 | US$ 1.944.976.916 | US$ 4.361.728.627 |
| 2024 | US$ −3.940.437.636 | US$ 12.364.505.139 |
| 2023 | US$ −5.248.090.937 | US$ 26.267.380.170 |
| 2022 | US$ 8.810.431.895 | US$ 15.206.087.397 |
| 2021 | US$ 5.165.277.108 | US$ 6.658.049.679 |
| 2020 | US$ 973.445.344 | US$ 4.884.127.676 |
| 2019 | US$ 1.466.600.722 | US$ 6.649.187.838 |
| 2018 | US$ 1.726.550.037 | US$ 11.716.769.819 |
| 2017 | US$ 2.686.509.353 | US$ 11.516.861.462 |
| 2016 | US$ −515.650.078 | US$ 3.260.164.342 |
| 2015 | US$ 2.673.041.339 | US$ 11.758.994.011 |
| 2014 | US$ 4.085.227.627 | US$ 5.065.335.542 |
| 2013 | US$ 986.930.051 | US$ 9.821.661.858 |
| 2012 | US$ 6.394.069.822 | US$ 15.323.933.917 |
| 2011 | US$ 2.690.094.197 | US$ 10.839.930.945 |
| 2010 | US$ 2.191.067.967 | US$ 11.332.718.626 |
| 2009 | US$ 1.602.591.813 | US$ 4.017.158.925 |
| 2008 | US$ 2.141.969.341 | US$ 9.725.553.130 |
| 2007 | US$ 1.358.736.506 | US$ 6.473.157.762 |
| 2006 | US$ 1.508.350.269 | US$ 5.537.347.786 |
| 2005 | US$ 826.626.704 | US$ 5.265.250.000 |
| 2004 | US$ 352.712.784 | US$ 4.124.710.000 |
| 2003 | US$ 402.717.369 | US$ 1.652.010.000 |
| 2002 | US$ 179.852.188 | US$ 2.148.910.000 |
| 2001 | US$ 310.402.928 | US$ 2.166.136.830 |
| 2000 | US$ 262.825.000 | US$ 10.418.314.339 |
| 1999 | US$ 235.300.000 | US$ 23.987.696.390 |
| 1998 | US$ 164.100.000 | US$ 7.290.657.132 |
| 1997 | US$ 113.200.000 | US$ 9.160.272.052 |
| 1996 | US$ 136.800.000 | US$ 6.948.536.687 |
| 1995 | US$ 156.600.000 | US$ 5.609.423.404 |
| 1994 | US$ 154.500.000 | US$ 3.634.931.878 |
| 1993 | US$ 101.500.000 | US$ 2.793.085.410 |
| 1992 | US$ 11.300.000 | US$ 4.430.977.523 |
| 1991 | US$ 32.340.000 | US$ 2.439.000.000 |
| 1990 | US$ 41.540.000 | US$ 1.836.000.000 |
| 1989 | US$ 37.700.000 | US$ 1.028.000.000 |
| 1988 | US$ 46.800.000 | US$ 1.147.000.000 |
| 1987 | US$ 50.100.000 | US$ −19.000.000 |
| 1986 | US$ 37.000.000 | US$ 574.000.000 |
| 1985 | US$ −7.900.000 | US$ 919.000.000 |
| 1984 | US$ 3.400.000 | US$ 268.000.000 |
| 1983 | US$ 5.600.000 | US$ 185.000.000 |
| 1982 | US$ −13.700.000 | US$ 227.000.000 |
| 1981 | US$ 48.600.000 | US$ 837.000.000 |
| 1980 | US$ 289.500.000 | US$ 678.000.000 |
| 1979 | US$ 215.500.000 | US$ 206.000.000 |
| 1978 | US$ 128.800.000 | US$ 250.000.000 |
| 1977 | US$ 66.000.000 | US$ 144.000.000 |
| 1976 | US$ 3.150.000 | US$ 244.680.000 |
| 1975 | US$ 22.640.000 | US$ 55.590.000 |
| 1974 | US$ −80.000 | US$ 17.920.000 |
| 1973 | US$ 1.390.000 | US$ 100.250.000 |
| 1972 | US$ −1.140.000 | US$ 71.720.000 |
| 1971 | US$ −830.000 | US$ 125.670.000 |
| 1970 | US$ 2.130.000 | US$ 89.770.000 |
Em 2025, as entradas líquidas de investimento estrangeiro direto foram de US$ 1,94 bilhão no Uruguai e de US$ 4,36 bilhões na Argentina: 2,2 vezes mais na Argentina. Em 1970, foram de US$ 2,13 milhões no Uruguai e de US$ 89,8 milhões na Argentina.
As entradas líquidas de investimento estrangeiro direto no Uruguai foram maiores que na Argentina em 2 dos 56 anos de 1970 a 2025, e menores em 54.
Uruguai vs Argentina: entradas e saídas mais recentes de investimento estrangeiro
|
Uruguai
|
Argentina
|
|
|---|---|---|
| Entradas líquidas | +US$ 1,94 bi | +US$ 4,36 bi |
| Entradas líquidas, % do PIB | +2,3% | +0,6% |
| Saídas líquidas | +US$ 1,41 bi | +US$ 2,74 bi |
| Entradas líquidas, total 2016–2025 | +US$ 13,1 bi | +US$ 103 bi |
| Posição mundial | 67/192 | 49/192 |
Comparar o investimento estrangeiro direto de 2 países quaisquer
Fontes:
- Banco Mundial | Financial Sector (1970–2025, atualizado em outubro de 2026)
Creative Commons Atribuição (CC BY): você pode copiar, compartilhar, adaptar e reutilizar este conteúdo, inclusive para fins comerciais, desde que cite o statistics.wiki e indique as alterações que fizer. As fontes listadas acima podem ter suas próprias condições de licença.