
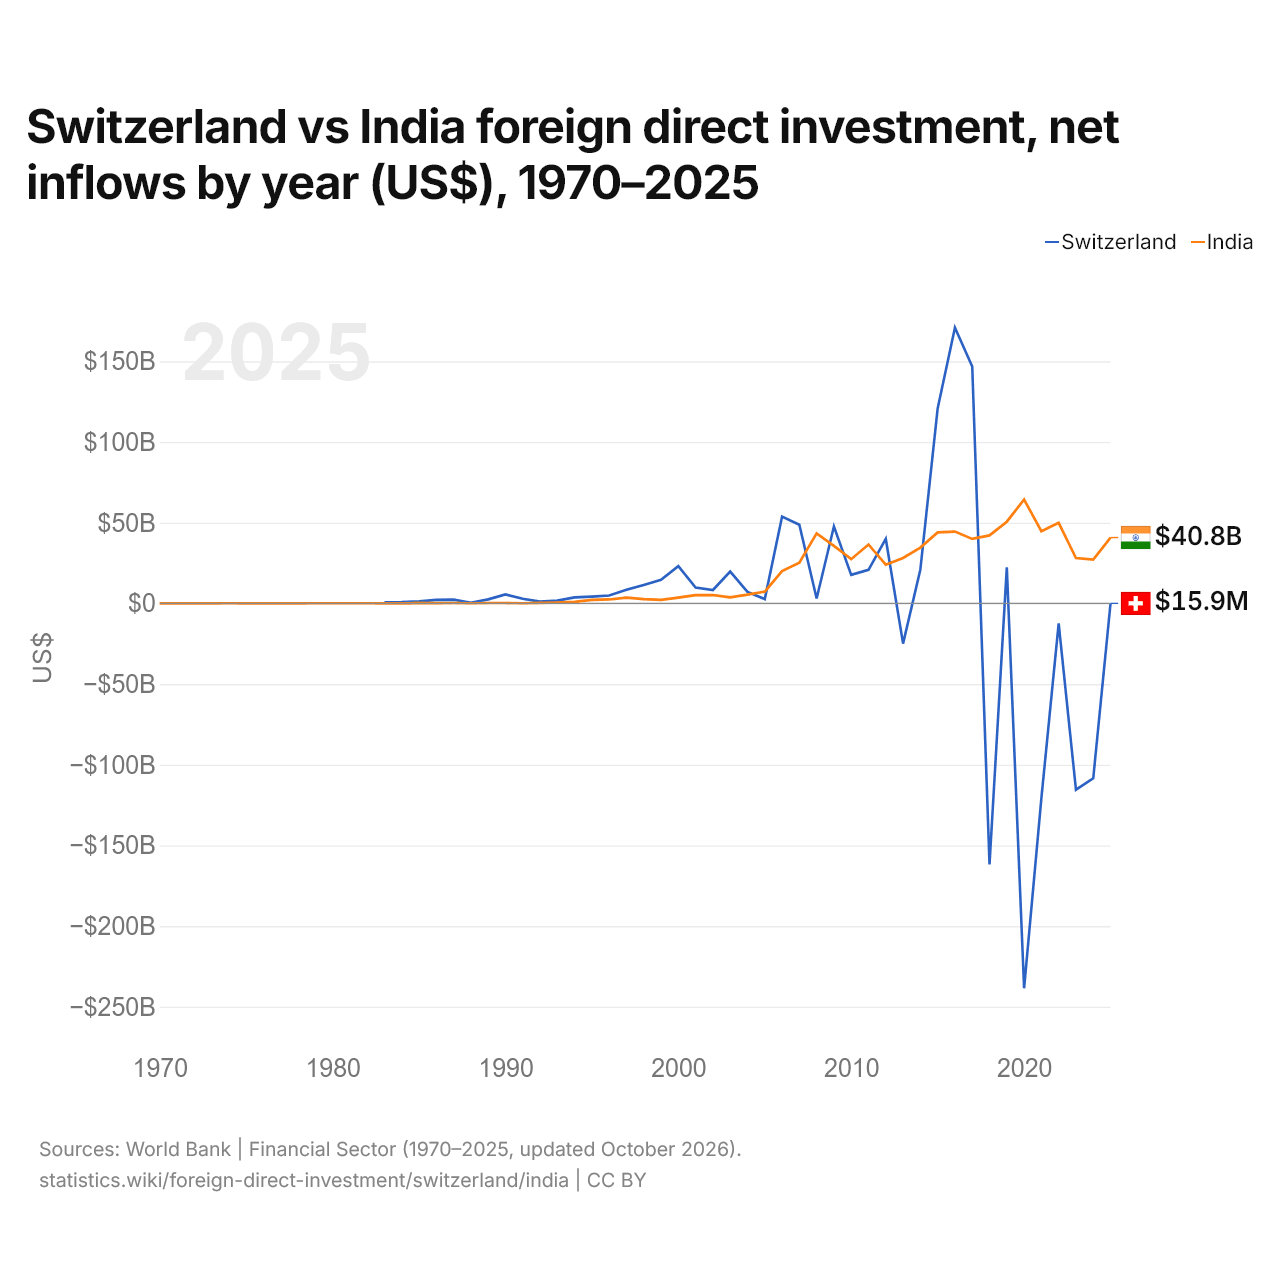
Suíça vs Índia: investimento estrangeiro direto, entradas líquidas por ano (US$), 1970–2025
1x
| Ano | US$ | |
|---|---|---|
 Suíça |
 Índia |
|
| 2025 | US$ 15.896.179 | US$ 40.791.693.367 |
| 2024 | US$ −108.395.568.634 | US$ 27.139.853.378 |
| 2023 | US$ −115.458.607.845 | US$ 28.086.193.530 |
| 2022 | US$ −12.414.047.155 | US$ 49.940.258.404 |
| 2021 | US$ −120.778.435.588 | US$ 44.727.277.563 |
| 2020 | US$ −238.563.810.400 | US$ 64.362.364.994 |
| 2019 | US$ 22.355.117.767 | US$ 50.610.647.354 |
| 2018 | US$ −161.796.242.279 | US$ 42.117.450.737 |
| 2017 | US$ 146.779.212.955 | US$ 39.966.091.359 |
| 2016 | US$ 170.848.654.801 | US$ 44.458.571.546 |
| 2015 | US$ 120.722.433.558 | US$ 44.009.492.130 |
| 2014 | US$ 21.003.091.522 | US$ 34.576.643.694 |
| 2013 | US$ −24.926.465.857 | US$ 28.153.031.270 |
| 2012 | US$ 39.943.494.322 | US$ 23.995.685.014 |
| 2011 | US$ 20.764.483.835 | US$ 36.498.654.598 |
| 2010 | US$ 17.670.735.603 | US$ 27.396.885.034 |
| 2009 | US$ 47.658.570.355 | US$ 35.581.372.930 |
| 2008 | US$ 2.990.936.685 | US$ 43.406.277.076 |
| 2007 | US$ 48.688.296.543 | US$ 25.227.740.887 |
| 2006 | US$ 53.760.772.986 | US$ 20.029.119.267 |
| 2005 | US$ 2.664.910.821 | US$ 7.269.407.226 |
| 2004 | US$ 7.102.294.153 | US$ 5.429.250.990 |
| 2003 | US$ 19.721.053.893 | US$ 3.681.984.671 |
| 2002 | US$ 8.258.050.580 | US$ 5.208.967.106 |
| 2001 | US$ 9.765.012.889 | US$ 5.128.093.562 |
| 2000 | US$ 23.080.879.763 | US$ 3.584.217.307 |
| 1999 | US$ 14.541.329.308 | US$ 2.168.591.054 |
| 1998 | US$ 11.345.529.735 | US$ 2.634.651.658 |
| 1997 | US$ 8.391.921.106 | US$ 3.577.330.042 |
| 1996 | US$ 4.880.219.416 | US$ 2.426.057.022 |
| 1995 | US$ 4.158.247.960 | US$ 2.143.628.110 |
| 1994 | US$ 3.682.699.145 | US$ 973.271.469 |
| 1993 | US$ 1.706.937.974 | US$ 550.370.025 |
| 1992 | US$ 1.128.487.634 | US$ 276.512.439 |
| 1991 | US$ 2.838.789.161 | US$ 73.537.638 |
| 1990 | US$ 5.544.796.310 | US$ 236.690.000 |
| 1989 | US$ 2.497.180.494 | US$ 252.100.000 |
| 1988 | US$ 405.248.411 | US$ 91.250.000 |
| 1987 | US$ 2.320.291.937 | US$ 212.320.000 |
| 1986 | US$ 2.122.388.475 | US$ 117.730.000 |
| 1985 | US$ 1.267.334.792 | US$ 106.090.000 |
| 1984 | US$ 777.125.996 | US$ 19.240.000 |
| 1983 | US$ 642.643.620 | US$ 5.640.000 |
| 1982 | - | US$ 72.080.000 |
| 1981 | - | US$ 91.920.000 |
| 1980 | - | US$ 79.160.000 |
| 1979 | - | US$ 48.570.000 |
| 1978 | - | US$ 18.090.000 |
| 1977 | - | US$ −36.060.000 |
| 1976 | - | US$ −7.706.431 |
| 1975 | - | US$ −10.326.247 |
| 1974 | - | US$ 56.970.000 |
| 1973 | - | US$ 37.910.000 |
| 1972 | - | US$ 17.790.000 |
| 1971 | - | US$ 47.660.000 |
| 1970 | - | US$ 45.460.000 |
Em 2025, as entradas líquidas de investimento estrangeiro direto foram de US$ 15,9 milhões na Suíça e de US$ 40,8 bilhões na Índia: 2.600 vezes mais na Índia. Em 1983, foram de US$ 643 milhões na Suíça e de US$ 5,64 milhões na Índia.
As entradas líquidas de investimento estrangeiro direto na Suíça foram maiores que na Índia em 29 dos 43 anos de 1983 a 2025, e menores em 14.
Suíça vs Índia: entradas e saídas mais recentes de investimento estrangeiro
|
Suíça
|
Índia
|
|
|---|---|---|
| Entradas líquidas | +US$ 15,9 mi | +US$ 40,8 bi |
| Entradas líquidas, % do PIB | +0,0% | +1,0% |
| Saídas líquidas | +US$ 32,3 bi | +US$ 38,2 bi |
| Entradas líquidas, total 2016–2025 | -US$ 417 bi | +US$ 432 bi |
| Posição mundial | 165/192 | 12/192 |
Comparar o investimento estrangeiro direto de 2 países quaisquer
Fontes:
- Banco Mundial | Financial Sector (1970–2025, atualizado em outubro de 2026)
Creative Commons Atribuição (CC BY): você pode copiar, compartilhar, adaptar e reutilizar este conteúdo, inclusive para fins comerciais, desde que cite o statistics.wiki e indique as alterações que fizer. As fontes listadas acima podem ter suas próprias condições de licença.