
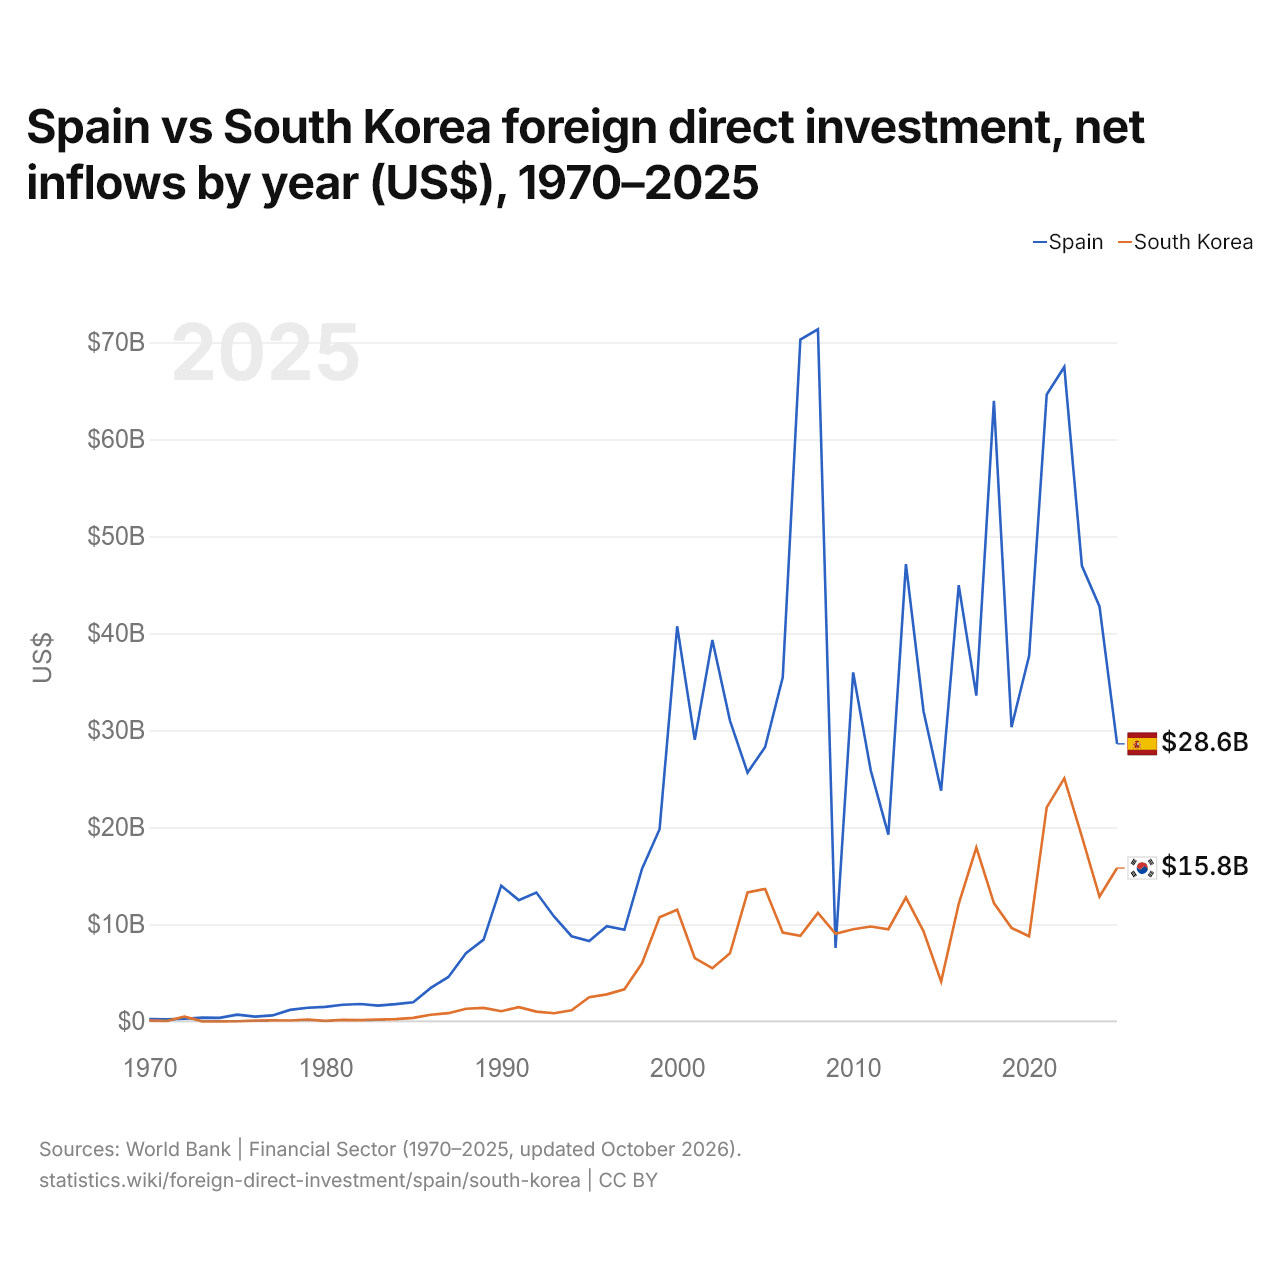
Espanha vs Coreia do Sul: investimento estrangeiro direto, entradas líquidas por ano (US$), 1970–2025
1x
| Ano | US$ | |
|---|---|---|
 Espanha |
 Coreia do Sul |
|
| 2025 | US$ 28.605.385.349 | US$ 15.804.100.000 |
| 2024 | US$ 42.778.827.261 | US$ 12.862.500.000 |
| 2023 | US$ 46.961.991.977 | US$ 19.042.300.000 |
| 2022 | US$ 67.459.796.904 | US$ 25.044.700.000 |
| 2021 | US$ 64.626.902.394 | US$ 22.060.400.000 |
| 2020 | US$ 37.683.095.972 | US$ 8.764.900.000 |
| 2019 | US$ 30.322.872.791 | US$ 9.634.300.000 |
| 2018 | US$ 63.958.429.157 | US$ 12.182.600.000 |
| 2017 | US$ 33.577.736.759 | US$ 17.912.900.000 |
| 2016 | US$ 44.962.670.966 | US$ 12.104.300.000 |
| 2015 | US$ 23.777.330.434 | US$ 4.104.100.000 |
| 2014 | US$ 31.972.292.815 | US$ 9.273.600.000 |
| 2013 | US$ 47.143.326.585 | US$ 12.766.600.000 |
| 2012 | US$ 19.250.404.232 | US$ 9.495.900.000 |
| 2011 | US$ 25.874.478.946 | US$ 9.773.000.000 |
| 2010 | US$ 35.969.020.813 | US$ 9.497.400.000 |
| 2009 | US$ 7.562.359.637 | US$ 9.021.900.000 |
| 2008 | US$ 71.347.116.196 | US$ 11.187.500.000 |
| 2007 | US$ 70.291.846.189 | US$ 8.826.900.000 |
| 2006 | US$ 35.455.663.078 | US$ 9.161.900.000 |
| 2005 | US$ 28.282.647.905 | US$ 13.643.200.000 |
| 2004 | US$ 25.642.926.665 | US$ 13.294.400.000 |
| 2003 | US$ 31.005.892.771 | US$ 7.010.000.000 |
| 2002 | US$ 39.314.607.366 | US$ 5.475.100.000 |
| 2001 | US$ 29.016.725.788 | US$ 6.522.300.000 |
| 2000 | US$ 40.723.543.114 | US$ 11.509.400.000 |
| 1999 | US$ 19.806.975.251 | US$ 10.726.300.000 |
| 1998 | US$ 15.714.658.309 | US$ 5.989.200.000 |
| 1997 | US$ 9.433.660.065 | US$ 3.301.100.000 |
| 1996 | US$ 9.801.379.213 | US$ 2.782.600.000 |
| 1995 | US$ 8.281.607.345 | US$ 2.487.100.000 |
| 1994 | US$ 8.772.628.137 | US$ 1.136.600.000 |
| 1993 | US$ 10.808.165.173 | US$ 832.300.000 |
| 1992 | US$ 13.275.723.087 | US$ 1.001.600.000 |
| 1991 | US$ 12.492.782.829 | US$ 1.455.200.000 |
| 1990 | US$ 13.983.611.812 | US$ 1.045.600.000 |
| 1989 | US$ 8.428.379.549 | US$ 1.389.600.000 |
| 1988 | US$ 7.020.568.174 | US$ 1.293.100.000 |
| 1987 | US$ 4.570.700.793 | US$ 838.600.000 |
| 1986 | US$ 3.450.598.177 | US$ 682.500.000 |
| 1985 | US$ 1.967.804.468 | US$ 355.300.000 |
| 1984 | US$ 1.771.829.760 | US$ 223.300.000 |
| 1983 | US$ 1.622.388.936 | US$ 184.300.000 |
| 1982 | US$ 1.782.685.066 | US$ 120.900.000 |
| 1981 | US$ 1.706.766.879 | US$ 155.100.000 |
| 1980 | US$ 1.492.697.190 | US$ 47.100.000 |
| 1979 | US$ 1.396.810.449 | US$ 172.000.000 |
| 1978 | US$ 1.178.156.262 | US$ 89.000.000 |
| 1977 | US$ 607.674.770 | US$ 94.000.000 |
| 1976 | US$ 477.622.020 | US$ 81.000.000 |
| 1975 | US$ 682.635.311 | US$ 6.000.000 |
| 1974 | US$ 358.000.000 | US$ 2.000.000 |
| 1973 | US$ 390.000.000 | US$ 4.000.000 |
| 1972 | US$ 268.000.000 | US$ 496.000.000 |
| 1971 | US$ 202.000.000 | US$ 42.000.000 |
| 1970 | US$ 222.000.000 | US$ 66.000.000 |
Em 2025, as entradas líquidas de investimento estrangeiro direto foram de US$ 28,6 bilhões na Espanha e de US$ 15,8 bilhões na Coreia do Sul: 1,8 vezes mais na Espanha. Em 1970, foram de US$ 222 milhões na Espanha e de US$ 66 milhões na Coreia do Sul.
As entradas líquidas de investimento estrangeiro direto na Espanha foram maiores que na Coreia do Sul em 54 dos 56 anos de 1970 a 2025, e menores em 2.
Espanha vs Coreia do Sul: entradas e saídas mais recentes de investimento estrangeiro
|
Espanha
|
Coreia do Sul
|
|
|---|---|---|
| Entradas líquidas | +US$ 28,6 bi | +US$ 15,8 bi |
| Entradas líquidas, % do PIB | +1,5% | +0,8% |
| Saídas líquidas | +US$ 47,2 bi | +US$ 41,2 bi |
| Entradas líquidas, total 2016–2025 | +US$ 461 bi | +US$ 155 bi |
| Posição mundial | 17/192 | 26/192 |
Comparar o investimento estrangeiro direto de 2 países quaisquer
Fontes:
- Banco Mundial | Financial Sector (1970–2025, atualizado em outubro de 2026)
Creative Commons Atribuição (CC BY): você pode copiar, compartilhar, adaptar e reutilizar este conteúdo, inclusive para fins comerciais, desde que cite o statistics.wiki e indique as alterações que fizer. As fontes listadas acima podem ter suas próprias condições de licença.