
Catar vs Kuwait: investimento estrangeiro direto, entradas líquidas por ano (US$), 1970–2025
| Ano | US$ | |
|---|---|---|
 Catar |
 Kuwait |
|
| 2025 | US$ 3.032.967.033 | US$ 413.089.669 |
| 2024 | US$ 460.164.835 | US$ 614.580.246 |
| 2023 | US$ −474.175.824 | US$ 2.114.603.345 |
| 2022 | US$ 76.098.901 | US$ 752.255.306 |
| 2021 | US$ −1.093.406.593 | US$ −272.335.307 |
| 2020 | US$ −2.434.065.934 | US$ −558.055.523 |
| 2019 | US$ −2.812.637.363 | US$ 515.617.569 |
| 2018 | US$ −2.186.263.736 | US$ −21.377.569 |
| 2017 | US$ 985.989.011 | US$ 113.012.065 |
| 2016 | US$ 773.901.099 | US$ 292.026.510 |
| 2015 | US$ 1.070.879.121 | US$ 284.647.624 |
| 2014 | US$ 1.040.384.615 | US$ 485.806.658 |
| 2013 | US$ −840.384.615 | US$ 1.433.630.444 |
| 2012 | US$ 395.879.121 | US$ 2.872.588.962 |
| 2011 | US$ 938.516.484 | US$ 3.259.067.552 |
| 2010 | US$ 4.670.329.670 | US$ 1.304.627.500 |
| 2009 | US$ 8.124.736.264 | US$ 1.113.588.047 |
| 2008 | US$ 3.778.626.374 | US$ −5.951.753 |
| 2007 | US$ 4.700.000.000 | US$ 111.535.690 |
| 2006 | US$ 3.500.000.000 | US$ 121.305.596 |
| 2005 | US$ 2.500.000.000 | US$ 233.904.110 |
| 2004 | US$ 1.198.970.000 | US$ 23.752.969 |
| 2003 | US$ 624.920.000 | US$ −67.111.499 |
| 2002 | US$ 623.920.000 | US$ 3.619.442 |
| 2001 | US$ 295.520.000 | US$ −111.516.285 |
| 2000 | US$ 251.600.000 | US$ 16.299.834 |
| 1999 | US$ 113.250.000 | US$ 72.269.842 |
| 1998 | US$ 347.300.000 | US$ 59.063.714 |
| 1997 | US$ 418.330.000 | US$ 19.779.209 |
| 1996 | US$ 338.870.000 | US$ 347.351.455 |
| 1995 | US$ 93.560.000 | US$ 6.701.341 |
| 1994 | US$ 131.850.000 | US$ 1.519.181.869 |
| 1993 | US$ 72.050.000 | US$ 13.252.098 |
| 1992 | US$ 39.580.000 | US$ 35.300.000 |
| 1991 | US$ 42.540.000 | US$ 800.000 |
| 1990 | US$ 4.880.000 | US$ 5.600.000 |
| 1989 | US$ −1.500.000 | US$ 3.660.000 |
| 1988 | US$ −20.630.000 | US$ 16.320.000 |
| 1987 | US$ −2.970.000 | US$ −6.320.000 |
| 1986 | US$ −1.470.000 | US$ −14.530.000 |
| 1985 | US$ 7.970.000 | US$ 7.250.000 |
| 1984 | US$ −14.940.000 | US$ −6.030.000 |
| 1983 | US$ 950.000 | US$ 40.000 |
| 1982 | US$ 3.710.000 | US$ −90.000 |
| 1981 | US$ 3.780.000 | US$ 1.210.000 |
| 1980 | US$ 10.840.000 | US$ 830.000 |
| 1979 | US$ 4.570.000 | US$ 1.280.000 |
| 1978 | US$ 8.910.000 | US$ 760.000 |
| 1977 | US$ 2.020.000 | US$ 1.330.000 |
| 1976 | US$ 200.000 | US$ −510.000 |
| 1975 | US$ 9.120.000 | US$ 250.000 |
| 1974 | US$ 12.970.000 | US$ 120.000 |
| 1973 | US$ 1.320.000 | US$ 300.000 |
| 1972 | US$ 10.000 | US$ 10.000 |
| 1971 | US$ 27.340.000 | US$ 10.000 |
| 1970 | US$ 5.690.000 | US$ 25.990.000 |
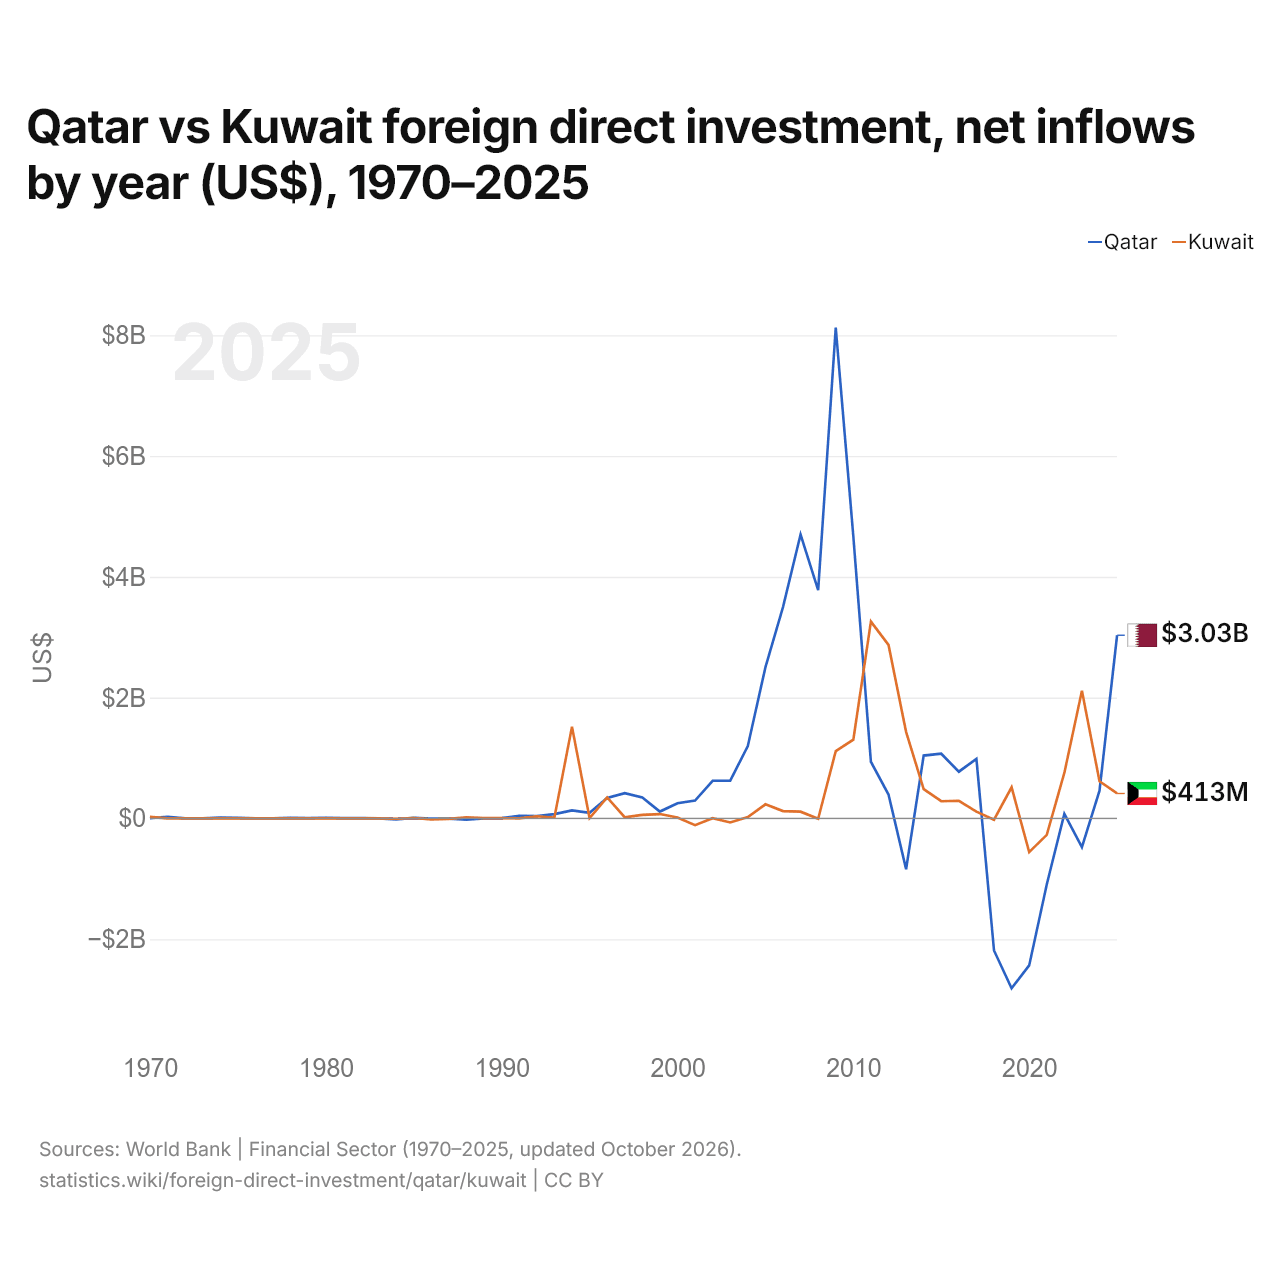
Em 2025, as entradas líquidas de investimento estrangeiro direto foram de US$ 3,03 bilhões no Catar e de US$ 413 milhões no Kuwait: 7,3 vezes mais no Catar. Em 1970, foram de US$ 5,69 milhões no Catar e de US$ 26 milhões no Kuwait.
As entradas líquidas de investimento estrangeiro direto no Catar foram maiores que no Kuwait em 38 dos 56 anos de 1970 a 2025, e menores em 17. As entradas líquidas no Catar e no Kuwait foram negativas (desinvestimento) ao mesmo tempo em 6 desses anos, o mais recente em 2021.
Catar vs Kuwait: entradas e saídas mais recentes de investimento estrangeiro
|
Catar
|
Kuwait
|
|
|---|---|---|
| Entradas líquidas | +US$ 3,03 bi | +US$ 413 mi |
| Entradas líquidas, % do PIB | +1,4% | +0,3% |
| Saídas líquidas | +US$ 3,34 bi | +US$ 2,99 bi |
| Entradas líquidas, total 2016–2025 | -US$ 3,67 bi | +US$ 3,96 bi |
| Posição mundial | 58/192 | 119/192 |
Comparar o investimento estrangeiro direto de 2 países quaisquer
Fontes:
- Banco Mundial | Financial Sector (1970–2025, atualizado em outubro de 2026)
Creative Commons Atribuição (CC BY): você pode copiar, compartilhar, adaptar e reutilizar este conteúdo, inclusive para fins comerciais, desde que cite o statistics.wiki e indique as alterações que fizer. As fontes listadas acima podem ter suas próprias condições de licença.