
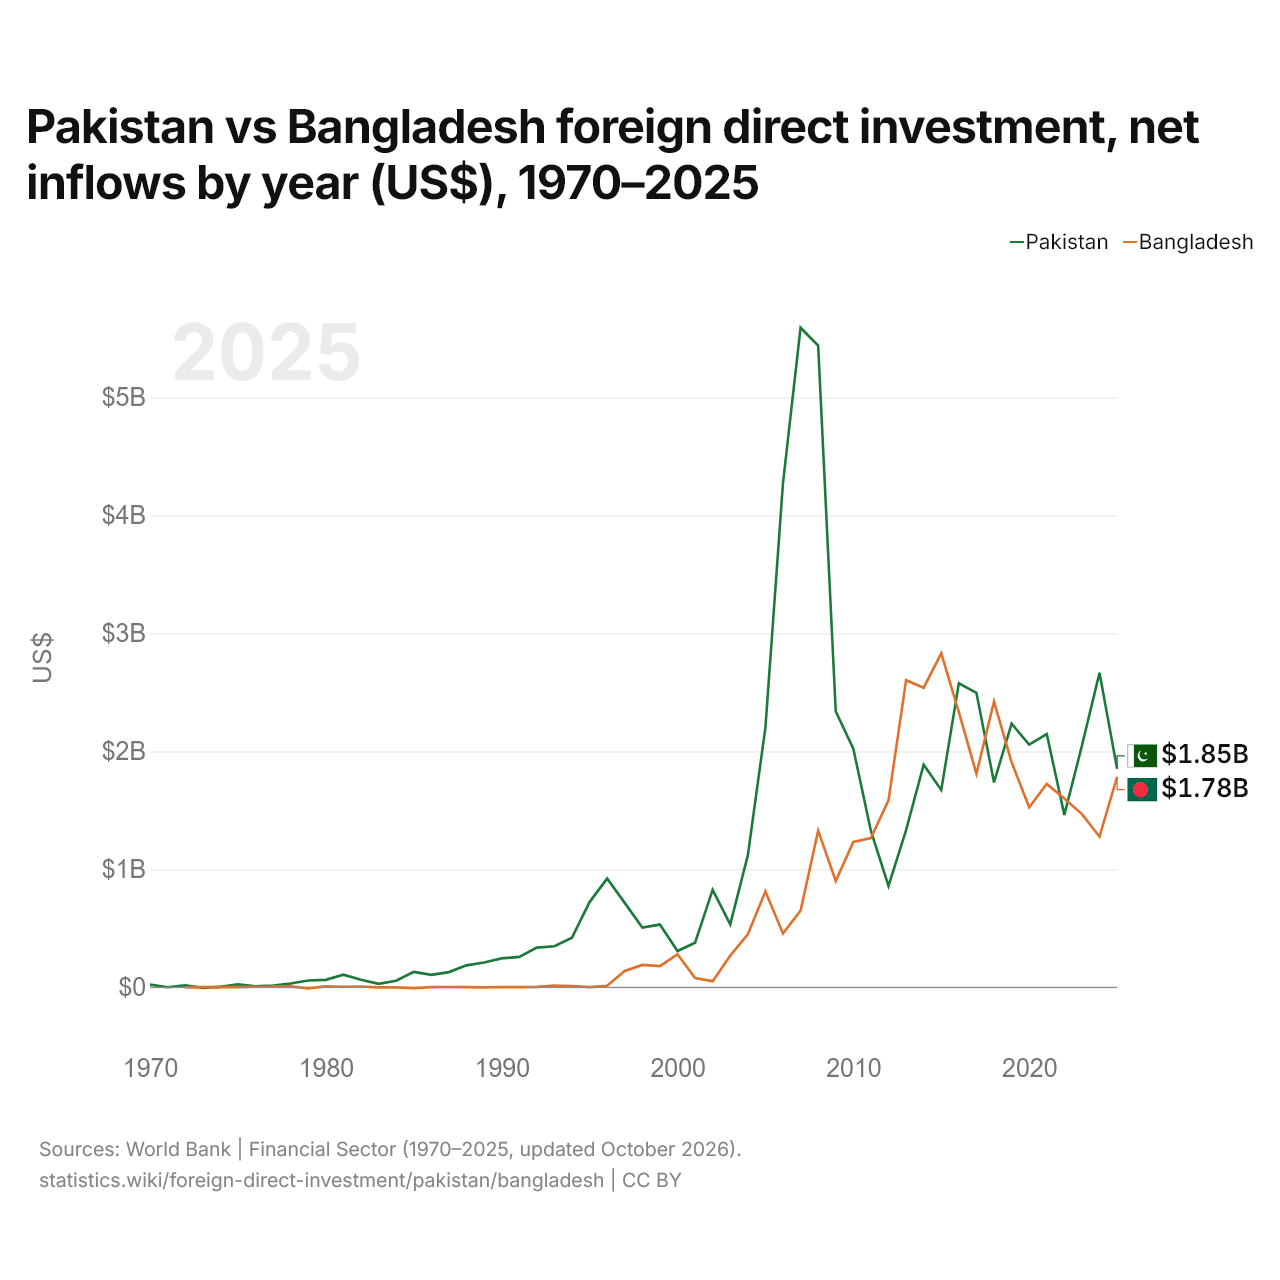
Paquistão vs Bangladesh: investimento estrangeiro direto, entradas líquidas por ano (US$), 1970–2025
1x
| Ano | US$ | |
|---|---|---|
 Paquistão |
 Bangladesh |
|
| 2025 | US$ 1.852.000.000 | US$ 1.784.539.607 |
| 2024 | US$ 2.665.000.000 | US$ 1.277.757.513 |
| 2023 | US$ 2.048.000.000 | US$ 1.468.497.340 |
| 2022 | US$ 1.462.000.000 | US$ 1.601.074.338 |
| 2021 | US$ 2.147.000.000 | US$ 1.723.856.464 |
| 2020 | US$ 2.057.000.000 | US$ 1.525.312.160 |
| 2019 | US$ 2.234.000.000 | US$ 1.908.045.387 |
| 2018 | US$ 1.737.000.000 | US$ 2.421.626.238 |
| 2017 | US$ 2.496.000.000 | US$ 1.810.395.804 |
| 2016 | US$ 2.576.000.000 | US$ 2.332.724.781 |
| 2015 | US$ 1.673.000.000 | US$ 2.831.152.765 |
| 2014 | US$ 1.887.000.000 | US$ 2.539.190.940 |
| 2013 | US$ 1.333.000.000 | US$ 2.602.962.095 |
| 2012 | US$ 859.000.000 | US$ 1.584.403.460 |
| 2011 | US$ 1.326.000.000 | US$ 1.264.725.163 |
| 2010 | US$ 2.022.000.000 | US$ 1.232.258.247 |
| 2009 | US$ 2.338.000.000 | US$ 901.286.583 |
| 2008 | US$ 5.438.000.000 | US$ 1.328.422.987 |
| 2007 | US$ 5.590.000.000 | US$ 651.029.738 |
| 2006 | US$ 4.273.000.000 | US$ 456.523.168 |
| 2005 | US$ 2.201.000.000 | US$ 813.321.972 |
| 2004 | US$ 1.118.000.000 | US$ 448.905.401 |
| 2003 | US$ 534.000.000 | US$ 268.285.232 |
| 2002 | US$ 826.000.000 | US$ 52.304.931 |
| 2001 | US$ 378.000.000 | US$ 78.527.040 |
| 2000 | US$ 308.000.000 | US$ 280.384.630 |
| 1999 | US$ 532.000.000 | US$ 179.603.006 |
| 1998 | US$ 506.000.000 | US$ 190.059.373 |
| 1997 | US$ 716.253.125 | US$ 139.376.153 |
| 1996 | US$ 921.976.183 | US$ 13.529.832 |
| 1995 | US$ 722.631.561 | US$ 1.896.372 |
| 1994 | US$ 421.024.638 | US$ 11.147.788 |
| 1993 | US$ 348.556.958 | US$ 14.049.887 |
| 1992 | US$ 336.479.857 | US$ 3.721.853 |
| 1991 | US$ 258.414.487 | US$ 1.390.444 |
| 1990 | US$ 245.262.963 | US$ 3.238.781 |
| 1989 | US$ 210.599.917 | US$ 247.908 |
| 1988 | US$ 186.491.557 | US$ 1.838.242 |
| 1987 | US$ 129.377.644 | US$ 3.205.087 |
| 1986 | US$ 105.730.332 | US$ 2.436.499 |
| 1985 | US$ 131.389.252 | US$ −6.660.000 |
| 1984 | US$ 55.510.170 | US$ −553.269 |
| 1983 | US$ 29.457.027 | US$ 403.979 |
| 1982 | US$ 63.833.092 | US$ 6.960.000 |
| 1981 | US$ 108.084.749 | US$ 5.360.000 |
| 1980 | US$ 63.632.993 | US$ 8.510.000 |
| 1979 | US$ 58.254.127 | US$ −8.010.000 |
| 1978 | US$ 32.273.193 | US$ 7.700.000 |
| 1977 | US$ 15.223.204 | US$ 6.980.000 |
| 1976 | US$ 8.220.530 | US$ 5.420.000 |
| 1975 | US$ 25.000.000 | US$ 1.543.333 |
| 1974 | US$ 4.000.000 | US$ 2.200.000 |
| 1973 | US$ −4.000.000 | US$ 2.340.000 |
| 1972 | US$ 17.000.000 | US$ 90.000 |
| 1971 | US$ 1.000.000 | - |
| 1970 | US$ 23.000.000 | - |
Em 2025, as entradas líquidas de investimento estrangeiro direto foram de US$ 1,85 bilhão no Paquistão e de US$ 1,78 bilhão no Bangladesh: 3,8% a mais no Paquistão. Em 1972, foram de US$ 17 milhões no Paquistão e de US$ 90.000 no Bangladesh.
As entradas líquidas de investimento estrangeiro direto no Paquistão foram maiores que no Bangladesh em 47 dos 54 anos de 1972 a 2025, e menores em 7.
Paquistão vs Bangladesh: entradas e saídas mais recentes de investimento estrangeiro
|
Paquistão
|
Bangladesh
|
|
|---|---|---|
| Entradas líquidas | +US$ 1,85 bi | +US$ 1,78 bi |
| Entradas líquidas, % do PIB | +0,5% | +0,4% |
| Saídas líquidas | +US$ 267 mi | +US$ 34,4 mi |
| Entradas líquidas, total 2016–2025 | +US$ 21,3 bi | +US$ 17,9 bi |
| Posição mundial | 70/192 | 73/192 |
Comparar o investimento estrangeiro direto de 2 países quaisquer
Fontes:
- Banco Mundial | Financial Sector (1970–2025, atualizado em outubro de 2026)
Creative Commons Atribuição (CC BY): você pode copiar, compartilhar, adaptar e reutilizar este conteúdo, inclusive para fins comerciais, desde que cite o statistics.wiki e indique as alterações que fizer. As fontes listadas acima podem ter suas próprias condições de licença.