
Libéria vs Gana: investimento estrangeiro direto, entradas líquidas por ano (US$), 1970–2025
1x
| Ano | US$ | |
|---|---|---|
 Libéria |
 Gana |
|
| 2025 | US$ 500.000.000 | US$ 1.908.244.011 |
| 2024 | US$ 471.538.317 | US$ 1.765.552.580 |
| 2023 | US$ 312.281.352 | US$ 1.319.315.615 |
| 2022 | US$ 123.765.394 | US$ 1.428.411.737 |
| 2021 | US$ −39.290.947 | US$ 2.533.586.462 |
| 2020 | US$ −94.014.462 | US$ 1.875.782.953 |
| 2019 | US$ 86.681.700 | US$ 3.879.831.470 |
| 2018 | US$ 129.129.755 | US$ 2.989.035.000 |
| 2017 | US$ 247.842.983 | US$ 3.254.990.000 |
| 2016 | US$ 311.699.760 | US$ 3.485.333.369 |
| 2015 | US$ 232.679.832 | US$ 3.192.320.531 |
| 2014 | US$ 501.870.829 | US$ 3.363.389.444 |
| 2013 | US$ 1.998.675.366 | US$ 3.227.000.000 |
| 2012 | US$ 2.309.981.241 | US$ 3.294.520.000 |
| 2011 | US$ 2.086.006.933 | US$ 3.247.588.000 |
| 2010 | US$ 2.064.680.994 | US$ 2.527.350.000 |
| 2009 | US$ 127.803.425 | US$ 2.372.540.000 |
| 2008 | US$ 283.536.077 | US$ 2.714.916.344 |
| 2007 | US$ 131.637.662 | US$ 1.383.177.930 |
| 2006 | US$ 107.856.672 | US$ 636.010.000 |
| 2005 | US$ 82.802.111 | US$ 144.970.000 |
| 2004 | US$ 75.351.732 | US$ 139.270.000 |
| 2003 | US$ 372.220.000 | US$ 136.751.000 |
| 2002 | US$ 2.800.000 | US$ 58.930.000 |
| 2001 | US$ 8.300.000 | US$ 89.320.000 |
| 2000 | US$ 20.800.000 | US$ 165.900.000 |
| 1999 | US$ 256.260.000 | US$ 243.700.000 |
| 1998 | US$ 190.310.000 | US$ 167.400.000 |
| 1997 | US$ 213.820.000 | US$ 81.800.000 |
| 1996 | US$ −132.130.000 | US$ 120.000.000 |
| 1995 | US$ 4.600.000 | US$ 106.500.000 |
| 1994 | US$ 17.380.000 | US$ 233.000.000 |
| 1993 | US$ −53.620.000 | US$ 125.000.000 |
| 1992 | US$ −10.850.000 | US$ 22.500.000 |
| 1991 | US$ 8.410.000 | US$ 20.000.000 |
| 1990 | US$ 225.240.000 | US$ 14.800.000 |
| 1989 | US$ 656.040.000 | US$ 15.000.000 |
| 1988 | US$ 290.150.000 | US$ 5.000.000 |
| 1987 | US$ 829.049 | US$ 4.700.000 |
| 1986 | US$ −355.307 | US$ 4.300.000 |
| 1985 | US$ −348.847 | US$ 5.600.000 |
| 1984 | US$ 779.522 | US$ 2.000.000 |
| 1983 | US$ 1.057.307 | US$ 2.400.000 |
| 1982 | US$ 749.375 | US$ 16.300.000 |
| 1981 | US$ 287.950.000 | US$ 16.263.752 |
| 1980 | US$ 71.920.000 | US$ 15.600.000 |
| 1979 | US$ 41.210.000 | US$ −2.800.000 |
| 1978 | US$ 144.690.000 | US$ 9.696.237 |
| 1977 | US$ 170.450.000 | US$ 19.217.479 |
| 1976 | US$ 83.170.000 | US$ −18.260.970 |
| 1975 | US$ 180.410.000 | US$ 70.869.955 |
| 1974 | US$ 57.710.000 | US$ 14.270.000 |
| 1973 | US$ 74.840.000 | US$ 14.400.000 |
| 1972 | US$ 20.650.000 | US$ 11.500.000 |
| 1971 | US$ −33.960.000 | US$ 30.600.000 |
| 1970 | US$ 57.140.000 | US$ 67.800.000 |
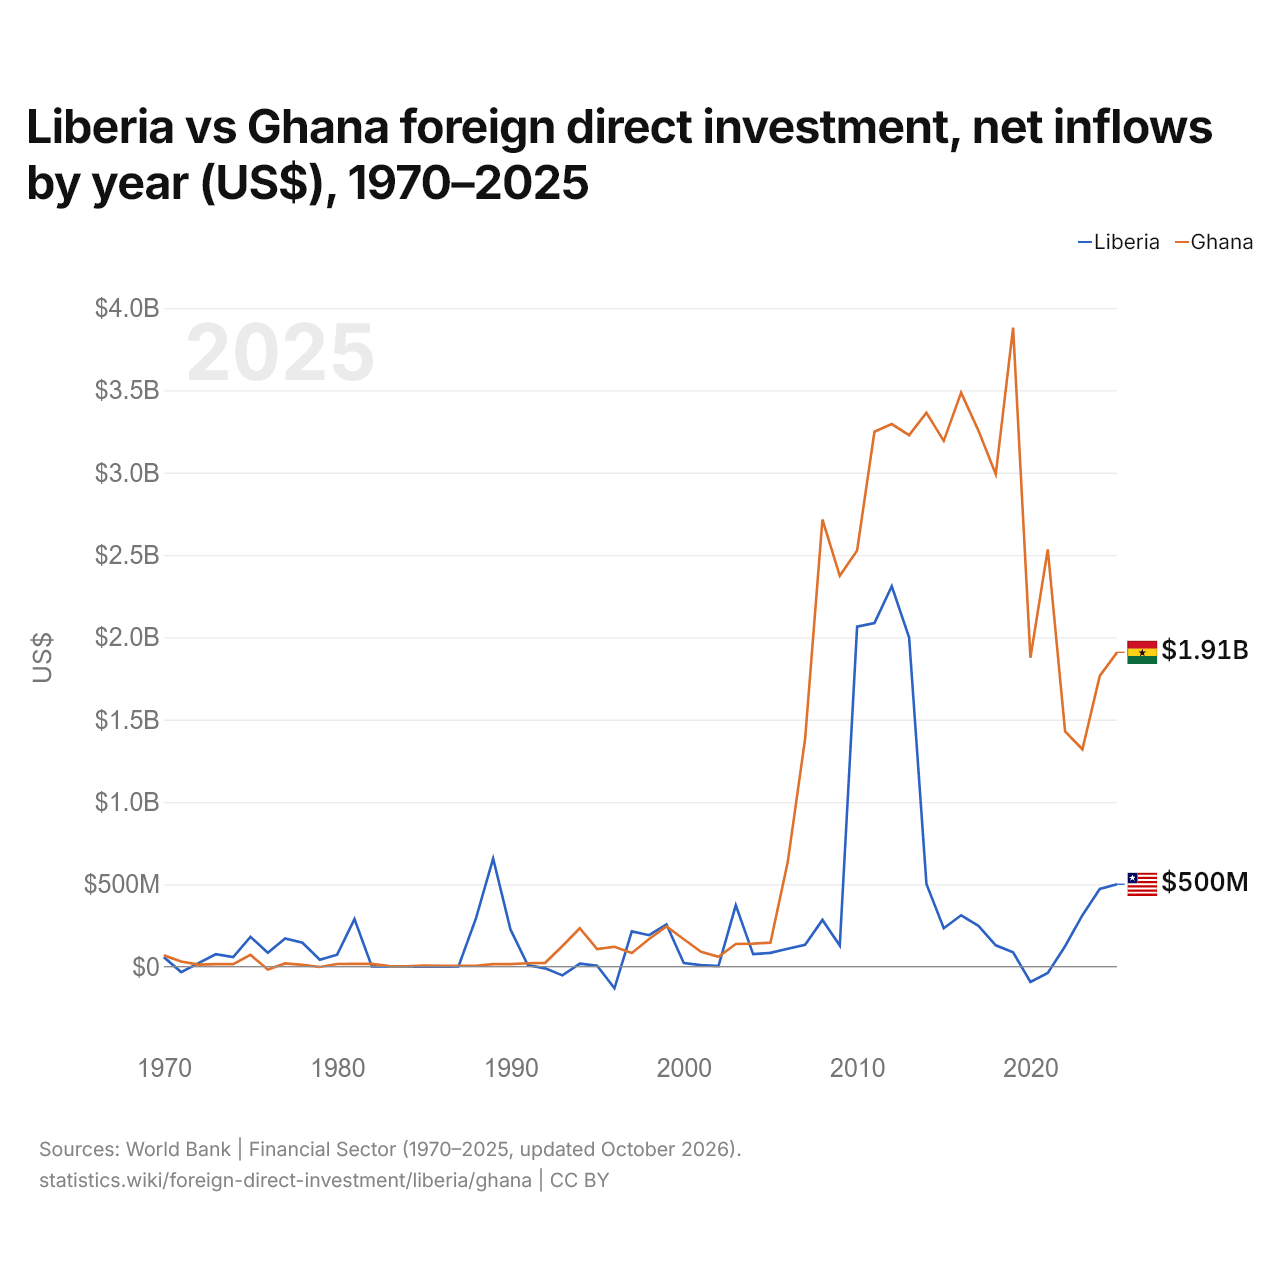
Em 2025, as entradas líquidas de investimento estrangeiro direto foram de US$ 500 milhões na Libéria e de US$ 1,91 bilhão em Gana: 3,8 vezes mais em Gana. Em 1970, foram de US$ 57,1 milhões na Libéria e de US$ 67,8 milhões em Gana.
As entradas líquidas de investimento estrangeiro direto na Libéria foram maiores que em Gana em 17 dos 56 anos de 1970 a 2025, e menores em 39.
Libéria vs Gana: entradas e saídas mais recentes de investimento estrangeiro
|
Libéria
|
Gana
|
|
|---|---|---|
| Entradas líquidas | +US$ 500 mi | +US$ 1,91 bi |
| Entradas líquidas, % do PIB | +9,5% | +1,7% |
| Saídas líquidas | +US$ 86,0 mi | +US$ 38,8 mi |
| Entradas líquidas, total 2016–2025 | +US$ 2,05 bi | +US$ 24,4 bi |
| Posição mundial | 116/192 | 68/192 |
Comparar o investimento estrangeiro direto de 2 países quaisquer
Fontes:
- Banco Mundial | Financial Sector (1970–2025, atualizado em outubro de 2026)
Creative Commons Atribuição (CC BY): você pode copiar, compartilhar, adaptar e reutilizar este conteúdo, inclusive para fins comerciais, desde que cite o statistics.wiki e indique as alterações que fizer. As fontes listadas acima podem ter suas próprias condições de licença.