
Guiana vs Barbados: investimento estrangeiro direto, entradas líquidas por ano (US$), 1970–2025
1x
| Ano | US$ | |
|---|---|---|
 Guiana |
 Barbados |
|
| 2025 | US$ 8.968.224.708 | US$ 273.091.359 |
| 2024 | US$ 8.629.500.000 | US$ 303.060.013 |
| 2023 | US$ −1.135.036.126 | US$ 224.900.000 |
| 2022 | US$ −2.996.952.015 | US$ 200.000.000 |
| 2021 | US$ 2.236.503.735 | US$ 238.735.064 |
| 2020 | US$ 1.283.062.521 | US$ 262.100.000 |
| 2019 | US$ 2.690.327.776 | US$ 215.370.129 |
| 2018 | US$ 1.231.760.000 | US$ 241.596.500 |
| 2017 | US$ 212.241.105 | US$ 91.481.933 |
| 2016 | US$ 58.000.000 | US$ 557.500.316 |
| 2015 | US$ 137.700.000 | US$ 688.525.943 |
| 2014 | US$ 237.750.049 | US$ 753.687.476 |
| 2013 | US$ 200.558.390 | US$ 104.089.451 |
| 2012 | US$ 277.910.000 | US$ 528.045.665 |
| 2011 | US$ 246.800.000 | US$ 459.552.936 |
| 2010 | US$ 198.000.000 | US$ 425.337.313 |
| 2009 | US$ 164.000.000 | US$ 356.008.255 |
| 2008 | US$ 178.000.000 | US$ 615.122.885 |
| 2007 | US$ 152.400.000 | US$ 476.404.577 |
| 2006 | US$ 102.400.000 | US$ 342.267.498 |
| 2005 | US$ 76.800.000 | US$ 390.061.396 |
| 2004 | US$ 30.000.000 | US$ 228.334.500 |
| 2003 | US$ 26.100.000 | US$ 184.701.289 |
| 2002 | US$ 43.600.000 | US$ 228.343.254 |
| 2001 | US$ 56.000.000 | US$ 91.504.911 |
| 2000 | US$ 67.100.000 | US$ 73.696.944 |
| 1999 | US$ 46.000.000 | US$ 47.539.505 |
| 1998 | US$ 44.000.000 | US$ 29.160.482 |
| 1997 | US$ 52.000.000 | US$ 28.203.499 |
| 1996 | US$ 59.000.000 | US$ 15.836.484 |
| 1995 | US$ 74.420.000 | US$ 63.803.750 |
| 1994 | US$ 106.690.000 | US$ 12.950.000 |
| 1993 | US$ 69.540.000 | US$ 9.402.114 |
| 1992 | US$ 146.610.000 | US$ 14.450.000 |
| 1991 | US$ 12.340.000 | US$ 7.424.921 |
| 1990 | US$ 7.900.000 | US$ 11.213.283 |
| 1989 | US$ −2.060.000 | US$ 8.682.964 |
| 1988 | US$ 2.100.000 | US$ 25.979.409 |
| 1987 | US$ 4.350.000 | US$ 7.100.000 |
| 1986 | US$ −9.000.000 | US$ 7.750.000 |
| 1985 | US$ 1.810.974 | US$ 4.850.000 |
| 1984 | US$ 4.489.020 | US$ 36.000.000 |
| 1983 | US$ 4.733.333 | US$ 16.150.000 |
| 1982 | US$ 4.433.333 | US$ 35.150.000 |
| 1981 | US$ −1.777.778 | US$ 37.300.000 |
| 1980 | US$ 588.235 | US$ 29.300.000 |
| 1979 | US$ 588.235 | US$ 30.305.500 |
| 1978 | US$ 4.020.000 | US$ 8.987.000 |
| 1977 | US$ −1.764.706 | US$ 4.914.000 |
| 1976 | US$ 5.010.000 | US$ 6.897.500 |
| 1975 | US$ 800.000 | US$ 4.489.152 |
| 1974 | US$ 1.360.000 | US$ 2.397.685 |
| 1973 | US$ 8.200.000 | US$ 5.630.300 |
| 1972 | US$ 2.500.000 | US$ 19.139.837 |
| 1971 | US$ −2.440.000 | US$ 15.656.172 |
| 1970 | US$ 9.000.000 | US$ 10.868.500 |
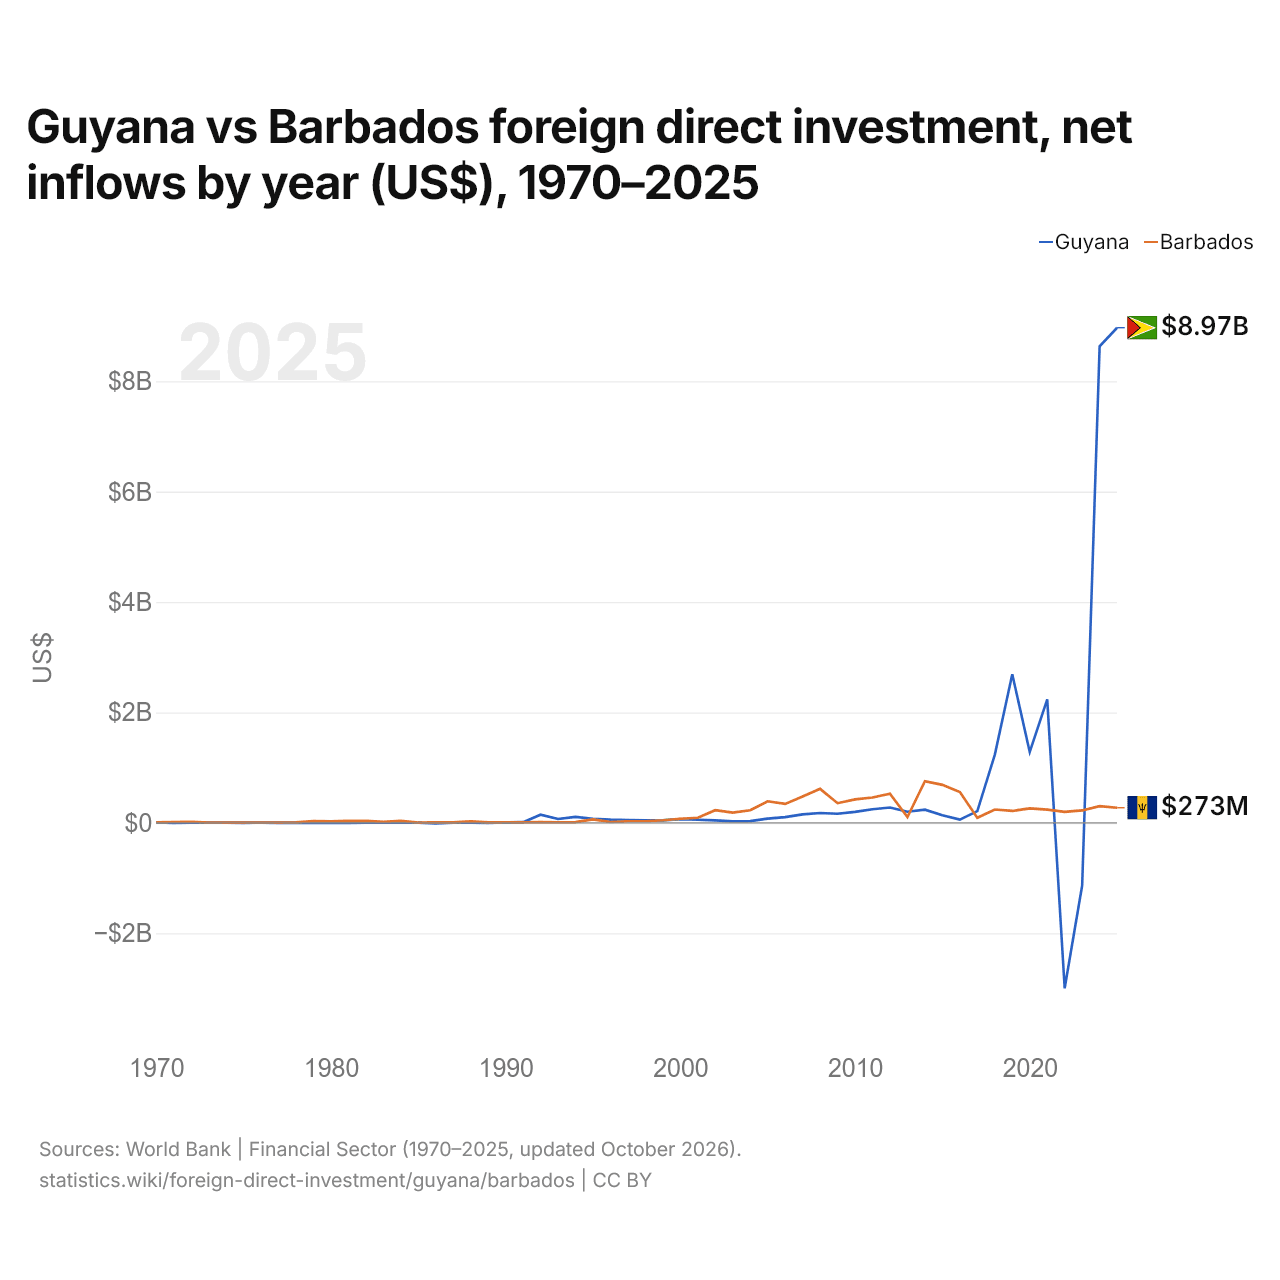
Em 2025, as entradas líquidas de investimento estrangeiro direto foram de US$ 8,97 bilhões na Guiana e de US$ 273 milhões em Barbados: 33 vezes mais na Guiana. Em 1970, foram de US$ 9 milhões na Guiana e de US$ 10,9 milhões em Barbados.
As entradas líquidas de investimento estrangeiro direto na Guiana foram maiores que em Barbados em 17 dos 56 anos de 1970 a 2025, e menores em 39.
Guiana vs Barbados: entradas e saídas mais recentes de investimento estrangeiro
|
Guiana
|
Barbados
|
|
|---|---|---|
| Entradas líquidas | +US$ 8,97 bi | +US$ 273 mi |
| Entradas líquidas, % do PIB | +33,1% | +3,4% |
| Saídas líquidas | +US$ 18,0 mi | +US$ 16,7 mi |
| Entradas líquidas, total 2016–2025 | +US$ 21,2 bi | +US$ 2,61 bi |
| Posição mundial | 39/192 | 130/192 |
Comparar o investimento estrangeiro direto de 2 países quaisquer
Fontes:
- Banco Mundial | Financial Sector (1970–2025, atualizado em outubro de 2026)
Creative Commons Atribuição (CC BY): você pode copiar, compartilhar, adaptar e reutilizar este conteúdo, inclusive para fins comerciais, desde que cite o statistics.wiki e indique as alterações que fizer. As fontes listadas acima podem ter suas próprias condições de licença.