
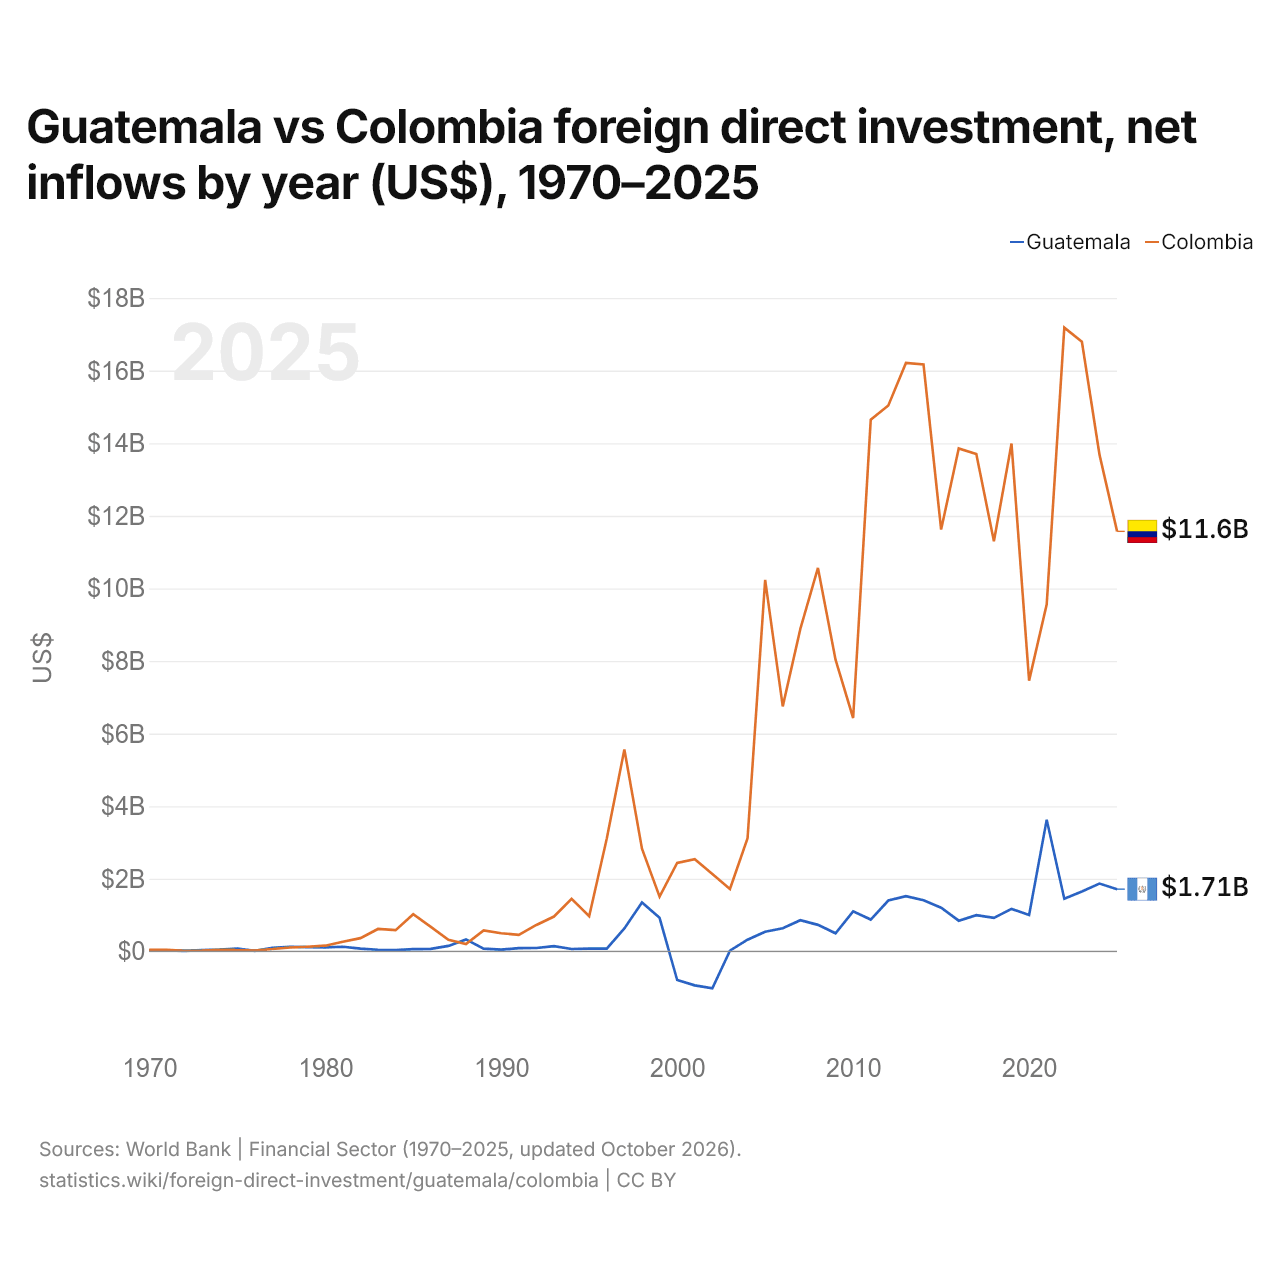
Guatemala vs Colômbia: investimento estrangeiro direto, entradas líquidas por ano (US$), 1970–2025
1x
| Ano | US$ | |
|---|---|---|
 Guatemala |
 Colômbia |
|
| 2025 | US$ 1.714.293.720 | US$ 11.571.143.771 |
| 2024 | US$ 1.868.650.070 | US$ 13.683.876.155 |
| 2023 | US$ 1.650.310.370 | US$ 16.793.702.729 |
| 2022 | US$ 1.450.072.830 | US$ 17.182.225.498 |
| 2021 | US$ 3.626.364.530 | US$ 9.561.335.277 |
| 2020 | US$ 1.004.371.660 | US$ 7.458.624.984 |
| 2019 | US$ 1.170.758.860 | US$ 13.989.154.028 |
| 2018 | US$ 922.397.870 | US$ 11.298.692.774 |
| 2017 | US$ 998.344.470 | US$ 13.700.880.445 |
| 2016 | US$ 845.786.560 | US$ 13.857.937.721 |
| 2015 | US$ 1.203.355.080 | US$ 11.620.532.646 |
| 2014 | US$ 1.407.555.280 | US$ 16.168.701.715 |
| 2013 | US$ 1.522.143.500 | US$ 16.210.419.016 |
| 2012 | US$ 1.399.819.890 | US$ 15.039.979.139 |
| 2011 | US$ 876.760.590 | US$ 14.647.048.638 |
| 2010 | US$ 1.102.460.180 | US$ 6.429.989.613 |
| 2009 | US$ 499.821.250 | US$ 8.034.746.177 |
| 2008 | US$ 731.386.670 | US$ 10.564.155.796 |
| 2007 | US$ 859.200.000 | US$ 8.885.764.398 |
| 2006 | US$ 635.300.000 | US$ 6.750.625.311 |
| 2005 | US$ 540.000.000 | US$ 10.235.417.315 |
| 2004 | US$ 321.400.000 | US$ 3.115.635.874 |
| 2003 | US$ 19.488.618 | US$ 1.720.493.455 |
| 2002 | US$ −1.016.996.774 | US$ 2.133.698.124 |
| 2001 | US$ −936.494.410 | US$ 2.541.942.612 |
| 2000 | US$ −788.600.000 | US$ 2.436.459.923 |
| 1999 | US$ 924.600.000 | US$ 1.507.907.130 |
| 1998 | US$ 1.346.300.000 | US$ 2.828.826.262 |
| 1997 | US$ 631.400.000 | US$ 5.562.216.362 |
| 1996 | US$ 76.900.000 | US$ 3.111.676.590 |
| 1995 | US$ 75.200.000 | US$ 968.368.274 |
| 1994 | US$ 65.200.000 | US$ 1.446.497.261 |
| 1993 | US$ 142.500.000 | US$ 959.100.000 |
| 1992 | US$ 94.100.000 | US$ 728.700.000 |
| 1991 | US$ 90.700.000 | US$ 456.900.000 |
| 1990 | US$ 47.700.000 | US$ 500.000.000 |
| 1989 | US$ 76.200.000 | US$ 576.000.000 |
| 1988 | US$ 329.900.000 | US$ 203.000.000 |
| 1987 | US$ 150.200.000 | US$ 319.000.000 |
| 1986 | US$ 68.800.000 | US$ 674.000.000 |
| 1985 | US$ 61.800.000 | US$ 1.023.000.000 |
| 1984 | US$ 38.000.000 | US$ 584.000.000 |
| 1983 | US$ 45.000.000 | US$ 618.000.000 |
| 1982 | US$ 77.100.000 | US$ 366.000.000 |
| 1981 | US$ 127.100.000 | US$ 265.000.000 |
| 1980 | US$ 110.700.000 | US$ 157.137.700 |
| 1979 | US$ 117.000.000 | US$ 127.000.000 |
| 1978 | US$ 127.200.000 | US$ 107.000.000 |
| 1977 | US$ 97.500.000 | US$ 65.000.000 |
| 1976 | US$ 12.500.000 | US$ 25.000.000 |
| 1975 | US$ 80.000.000 | US$ 37.068.850 |
| 1974 | US$ 47.400.000 | US$ 40.889.760 |
| 1973 | US$ 34.800.000 | US$ 23.842.600 |
| 1972 | US$ 15.900.000 | US$ 18.457.070 |
| 1971 | US$ 28.600.000 | US$ 43.128.140 |
| 1970 | US$ 29.400.000 | US$ 43.000.000 |
Em 2025, as entradas líquidas de investimento estrangeiro direto foram de US$ 1,71 bilhão na Guatemala e de US$ 11,6 bilhões na Colômbia: 6,7 vezes mais na Colômbia. Em 1970, foram de US$ 29,4 milhões na Guatemala e de US$ 43 milhões na Colômbia.
As entradas líquidas de investimento estrangeiro direto na Guatemala foram maiores que na Colômbia em 6 dos 56 anos de 1970 a 2025, e menores em 50.
Guatemala vs Colômbia: entradas e saídas mais recentes de investimento estrangeiro
|
Guatemala
|
Colômbia
|
|
|---|---|---|
| Entradas líquidas | +US$ 1,71 bi | +US$ 11,6 bi |
| Entradas líquidas, % do PIB | +1,4% | +2,5% |
| Saídas líquidas | +US$ 2,34 bi | +US$ 4,82 bi |
| Entradas líquidas, total 2016–2025 | +US$ 15,3 bi | +US$ 129 bi |
| Posição mundial | 75/192 | 33/192 |
Comparar o investimento estrangeiro direto de 2 países quaisquer
Fontes:
- Banco Mundial | Financial Sector (1970–2025, atualizado em outubro de 2026)
Creative Commons Atribuição (CC BY): você pode copiar, compartilhar, adaptar e reutilizar este conteúdo, inclusive para fins comerciais, desde que cite o statistics.wiki e indique as alterações que fizer. As fontes listadas acima podem ter suas próprias condições de licença.