
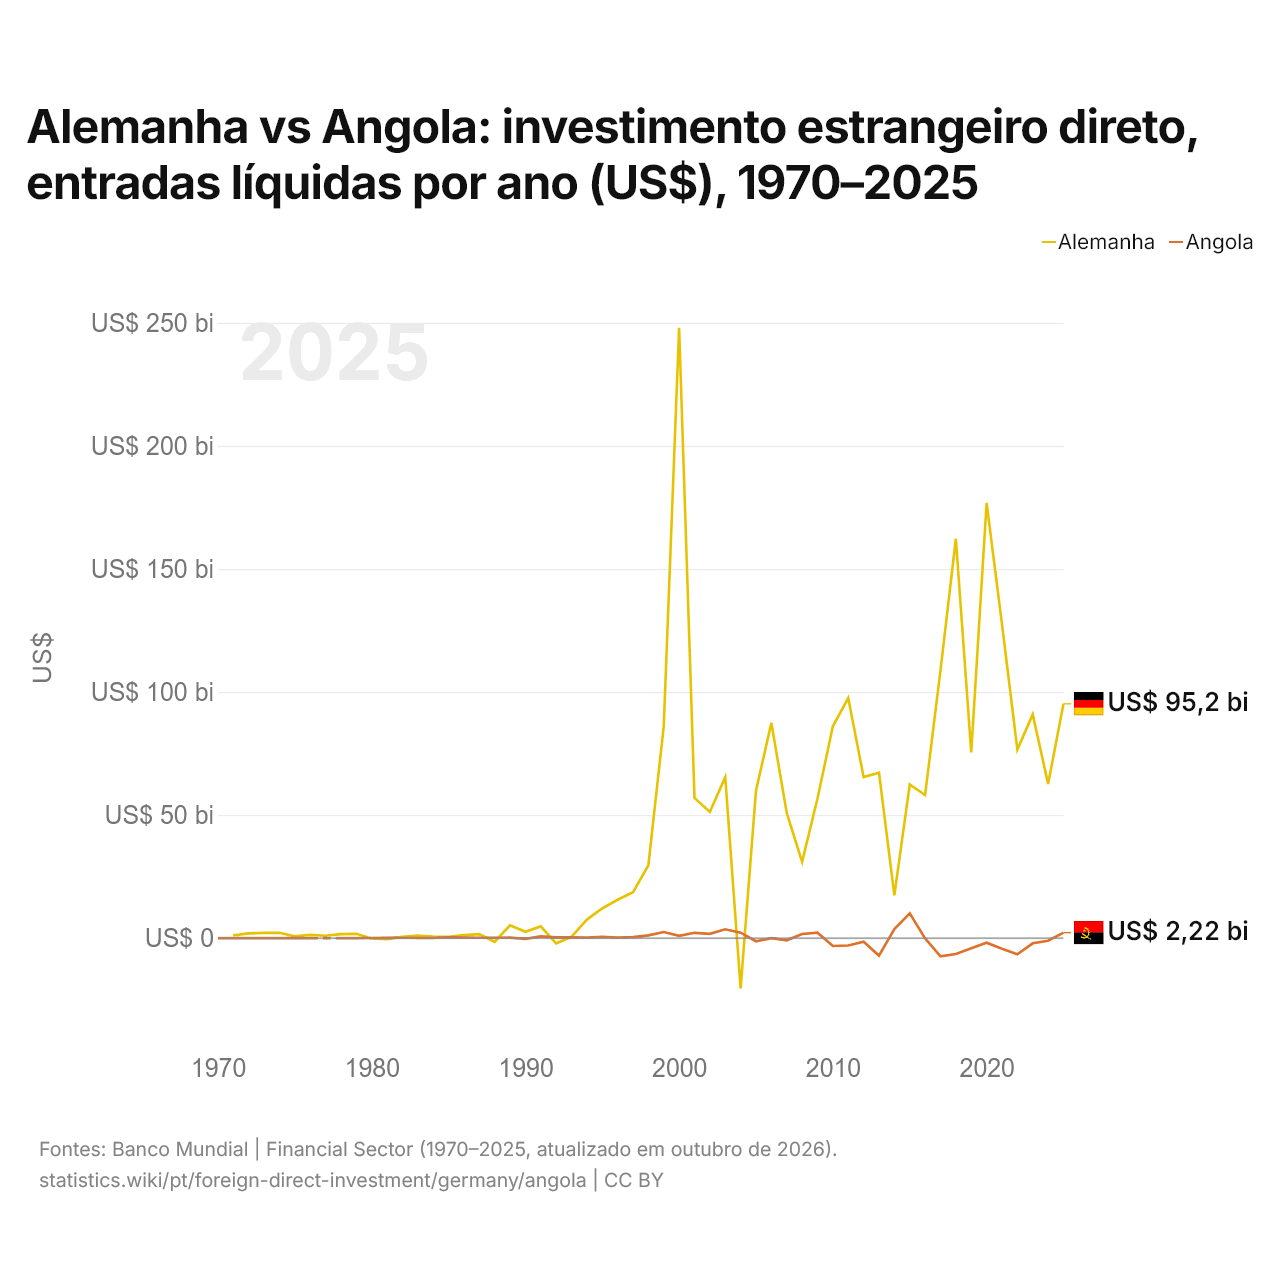
Alemanha vs Angola: investimento estrangeiro direto, entradas líquidas por ano (US$), 1970–2025
| Ano | US$ | |
|---|---|---|
 Alemanha |
 Angola |
|
| 2025 | US$ 95.190.853.681 | US$ 2.216.327.141 |
| 2024 | US$ 62.637.241.923 | US$ −1.109.663.097 |
| 2023 | US$ 90.884.107.610 | US$ −2.119.632.186 |
| 2022 | US$ 76.571.769.736 | US$ −6.598.652.652 |
| 2021 | US$ 127.609.826.748 | US$ −4.355.116.553 |
| 2020 | US$ 176.781.024.357 | US$ −1.866.468.113 |
| 2019 | US$ 75.463.438.451 | US$ −4.098.478.748 |
| 2018 | US$ 162.250.938.126 | US$ −6.456.076.413 |
| 2017 | US$ 108.786.501.529 | US$ −7.397.295.409 |
| 2016 | US$ 58.132.711.371 | US$ −179.517.619 |
| 2015 | US$ 62.418.993.509 | US$ 10.028.215.163 |
| 2014 | US$ 17.356.720.098 | US$ 3.657.514.667 |
| 2013 | US$ 67.199.694.459 | US$ −7.120.017.424 |
| 2012 | US$ 65.443.087.632 | US$ −1.464.627.991 |
| 2011 | US$ 97.535.403.953 | US$ −3.023.770.966 |
| 2010 | US$ 86.037.502.102 | US$ −3.227.211.182 |
| 2009 | US$ 56.701.916.795 | US$ 2.205.298.180 |
| 2008 | US$ 30.954.735.498 | US$ 1.678.971.010 |
| 2007 | US$ 50.847.183.837 | US$ −893.342.152 |
| 2006 | US$ 87.444.159.239 | US$ −37.714.860 |
| 2005 | US$ 59.835.195.025 | US$ −1.303.836.930 |
| 2004 | US$ −20.408.419.557 | US$ 2.197.227.820 |
| 2003 | US$ 65.401.516.009 | US$ 3.576.971.780 |
| 2002 | US$ 51.268.214.891 | US$ 1.743.504.000 |
| 2001 | US$ 56.948.542.387 | US$ 2.145.470.000 |
| 2000 | US$ 248.007.397.122 | US$ 878.620.000 |
| 1999 | US$ 86.035.665.071 | US$ 2.471.460.000 |
| 1998 | US$ 29.525.738.646 | US$ 1.113.970.000 |
| 1997 | US$ 18.638.428.446 | US$ 411.660.000 |
| 1996 | US$ 15.590.587.107 | US$ 180.559.000 |
| 1995 | US$ 12.040.789.985 | US$ 472.427.000 |
| 1994 | US$ 7.517.424.677 | US$ 170.300.000 |
| 1993 | US$ 477.658.764 | US$ 302.100.000 |
| 1992 | US$ −2.137.482.963 | US$ 287.956.000 |
| 1991 | US$ 4.741.546.059 | US$ 664.500.000 |
| 1990 | US$ 2.556.702.846 | US$ −334.800.000 |
| 1989 | US$ 5.173.426.485 | US$ 200.000.000 |
| 1988 | US$ −1.508.574.621 | US$ 131.000.000 |
| 1987 | US$ 1.620.170.657 | US$ 119.000.000 |
| 1986 | US$ 1.192.024.600 | US$ 234.000.000 |
| 1985 | US$ 531.108.429 | US$ 278.000.000 |
| 1984 | US$ 590.664.407 | US$ 67.140.000 |
| 1983 | US$ 997.855.447 | US$ 104.330.000 |
| 1982 | US$ 468.263.695 | US$ 115.810.000 |
| 1981 | US$ −415.839.560 | US$ 49.050.000 |
| 1980 | US$ −186.573.401 | US$ 37.420.000 |
| 1979 | US$ 1.732.552.304 | US$ 2.000.000 |
| 1978 | US$ 1.603.458.933 | US$ 1.870.000 |
| 1977 | US$ 949.983.809 | - |
| 1976 | US$ 1.321.369.938 | US$ −1.170.000 |
| 1975 | US$ 690.496.823 | US$ 50.000 |
| 1974 | US$ 2.176.992.344 | US$ 6.690.000 |
| 1973 | US$ 2.102.302.343 | US$ 7.540.000 |
| 1972 | US$ 1.897.270.696 | US$ 2.160.000 |
| 1971 | US$ 1.103.338.755 | US$ 1.860.000 |
| 1970 | - | US$ 2.400.000 |
Em 2025, as entradas líquidas de investimento estrangeiro direto foram de US$ 95,2 bilhões na Alemanha e de US$ 2,22 bilhões em Angola: 43 vezes mais na Alemanha. Em 1971, foram de US$ 1,1 bilhão na Alemanha e de US$ 1,86 milhão em Angola.
As entradas líquidas de investimento estrangeiro direto na Alemanha foram maiores que em Angola em 49 dos 54 anos de 1971 a 2025 que os dois países informaram, e menores em 5.
Alemanha vs Angola: entradas e saídas mais recentes de investimento estrangeiro
|
Alemanha
|
Angola
|
|
|---|---|---|
| Entradas líquidas | +US$ 95,2 bi | +US$ 2,22 bi |
| Entradas líquidas, % do PIB | +1,9% | +1,8% |
| Saídas líquidas | +US$ 108 bi | +US$ 125 mi |
| Entradas líquidas, total 2016–2025 | +US$ 1,03 tri | -US$ 32,0 bi |
| Posição mundial | 3/192 | 61/192 |
Comparar o investimento estrangeiro direto de 2 países quaisquer
Fontes:
- Banco Mundial | Financial Sector (1970–2025, atualizado em outubro de 2026)
Creative Commons Atribuição (CC BY): você pode copiar, compartilhar, adaptar e reutilizar este conteúdo, inclusive para fins comerciais, desde que cite o statistics.wiki e indique as alterações que fizer. As fontes listadas acima podem ter suas próprias condições de licença.