
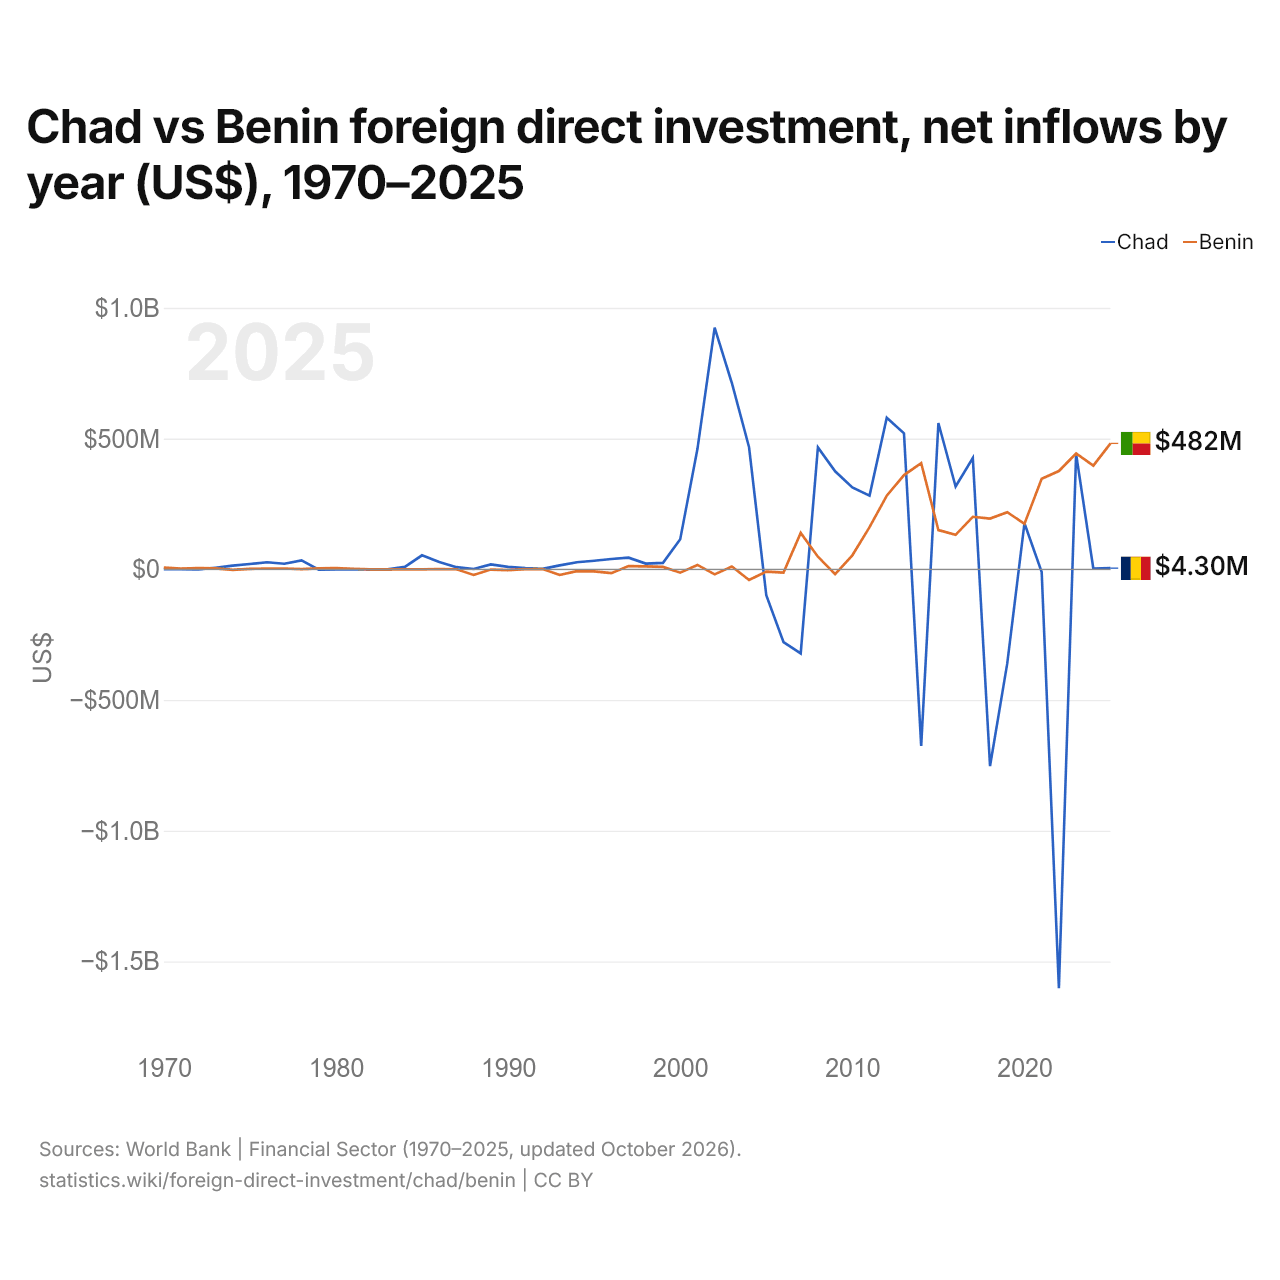
Chade vs Benin: investimento estrangeiro direto, entradas líquidas por ano (US$), 1970–2025
| Ano | US$ | |
|---|---|---|
 Chade |
 Benin |
|
| 2025 | US$ 4.296.061 | US$ 481.660.038 |
| 2024 | US$ 2.803.683 | US$ 396.390.573 |
| 2023 | US$ 441.660.666 | US$ 442.960.064 |
| 2022 | US$ −1.602.633.191 | US$ 375.988.902 |
| 2021 | US$ −10.711.761 | US$ 345.985.236 |
| 2020 | US$ 176.322.911 | US$ 174.019.952 |
| 2019 | US$ −359.909.603 | US$ 218.207.872 |
| 2018 | US$ −752.684.609 | US$ 194.073.683 |
| 2017 | US$ 425.611.172 | US$ 200.902.719 |
| 2016 | US$ 316.610.227 | US$ 131.790.854 |
| 2015 | US$ 559.642.023 | US$ 149.755.663 |
| 2014 | US$ −675.545.915 | US$ 405.737.369 |
| 2013 | US$ 520.200.751 | US$ 360.343.380 |
| 2012 | US$ 579.793.037 | US$ 281.548.556 |
| 2011 | US$ 281.900.000 | US$ 161.302.391 |
| 2010 | US$ 313.000.000 | US$ 53.507.088 |
| 2009 | US$ 374.900.000 | US$ −18.807.407 |
| 2008 | US$ 466.131.000 | US$ 48.210.758 |
| 2007 | US$ −321.655.000 | US$ 139.189.943 |
| 2006 | US$ −278.414.000 | US$ −12.363.482 |
| 2005 | US$ −99.342.519 | US$ −8.788.860 |
| 2004 | US$ 466.793.492 | US$ −40.774.605 |
| 2003 | US$ 712.663.455 | US$ 10.638.088 |
| 2002 | US$ 924.119.210 | US$ −19.395.623 |
| 2001 | US$ 459.866.392 | US$ 16.739.539 |
| 2000 | US$ 115.172.422 | US$ −12.794.844 |
| 1999 | US$ 24.524.971 | US$ 9.314.782 |
| 1998 | US$ 21.696.680 | US$ 11.294.143 |
| 1997 | US$ 44.293.941 | US$ 12.183.267 |
| 1996 | US$ 39.466.174 | US$ −14.661.254 |
| 1995 | US$ 32.611.570 | US$ −7.738.380 |
| 1994 | US$ 27.074.699 | US$ −7.107.469 |
| 1993 | US$ 15.160.902 | US$ −21.635.980 |
| 1992 | US$ 1.960.771 | US$ 954.317 |
| 1991 | US$ 4.239.528 | US$ 393.822 |
| 1990 | US$ 9.400.000 | US$ −2.954.844 |
| 1989 | US$ 18.739.324 | US$ −1.118.466 |
| 1988 | US$ 1.289.247 | US$ −21.662.040 |
| 1987 | US$ 8.162.068 | US$ 100.000 |
| 1986 | US$ 28.200.501 | US$ 1.100.000 |
| 1985 | US$ 53.650.094 | US$ −90.000 |
| 1984 | US$ 9.186.266 | US$ 11.443 |
| 1983 | US$ −90.000 | US$ 10.497 |
| 1982 | US$ −120.000 | US$ −12.173 |
| 1981 | US$ −110.000 | US$ 2.090.299 |
| 1980 | US$ −430.000 | US$ 4.316.556 |
| 1979 | US$ −1.290.000 | US$ 3.568.043 |
| 1978 | US$ 34.136.051 | US$ 753.360 |
| 1977 | US$ 21.153.560 | US$ 3.126.022 |
| 1976 | US$ 26.800.000 | US$ 2.452.391 |
| 1975 | US$ 20.300.000 | US$ 1.889.760 |
| 1974 | US$ 13.800.000 | US$ −2.343.120 |
| 1973 | US$ 6.100.000 | US$ 3.500.000 |
| 1972 | US$ −100.000 | US$ 4.800.000 |
| 1971 | US$ 300.000 | US$ 2.800.000 |
| 1970 | US$ 600.000 | US$ 6.700.000 |
Em 2025, as entradas líquidas de investimento estrangeiro direto foram de US$ 4,3 milhões no Chade e de US$ 482 milhões no Benin: 110 vezes mais no Benin. Em 1970, foram de US$ 600.000 no Chade e de US$ 6,7 milhões no Benin.
As entradas líquidas de investimento estrangeiro direto no Chade foram maiores que no Benin em 37 dos 56 anos de 1970 a 2025, e menores em 19. As entradas líquidas no Chade e no Benin foram negativas (desinvestimento) ao mesmo tempo em 3 desses anos, o mais recente em 2006.
Chade vs Benin: entradas e saídas mais recentes de investimento estrangeiro
|
Chade
|
Benin
|
|
|---|---|---|
| Entradas líquidas | +US$ 4,30 mi | +US$ 482 mi |
| Entradas líquidas, % do PIB | +0,0% | +2,0% |
| Saídas líquidas | -US$ 217 mi | +US$ 53,2 mi |
| Entradas líquidas, total 2016–2025 | -US$ 1,36 bi | +US$ 2,96 bi |
| Posição mundial | 170/192 | 117/192 |
Comparar o investimento estrangeiro direto de 2 países quaisquer
Fontes:
- Banco Mundial | Financial Sector (1970–2025, atualizado em outubro de 2026)
Creative Commons Atribuição (CC BY): você pode copiar, compartilhar, adaptar e reutilizar este conteúdo, inclusive para fins comerciais, desde que cite o statistics.wiki e indique as alterações que fizer. As fontes listadas acima podem ter suas próprias condições de licença.