
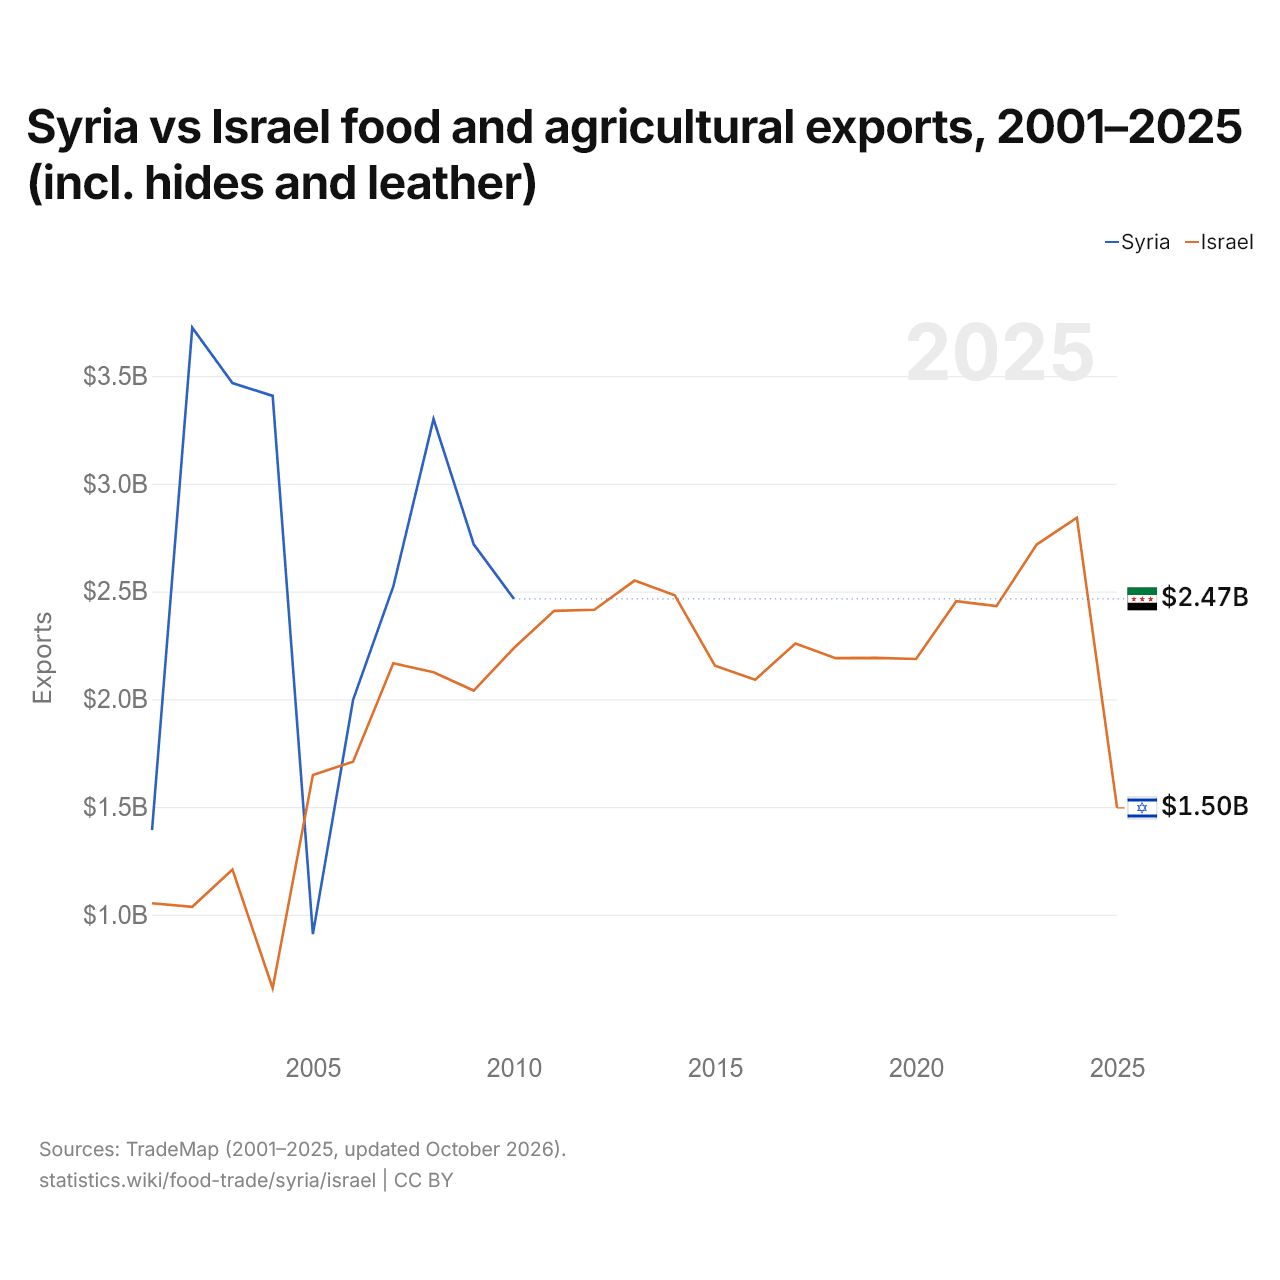
Síria vs Israel: exportações de alimentos e produtos agrícolas, 2001–2025 (inclui couros e peles)
| Ano | Exportações | |
|---|---|---|
 Síria |
 Israel |
|
| 2025 | - | US$ 1.495.453.000 |
| 2024 | - | US$ 2.842.434.000 |
| 2023 | - | US$ 2.717.784.000 |
| 2022 | - | US$ 2.431.776.000 |
| 2021 | - | US$ 2.454.838.000 |
| 2020 | - | US$ 2.186.449.000 |
| 2019 | - | US$ 2.191.698.000 |
| 2018 | - | US$ 2.190.189.000 |
| 2017 | - | US$ 2.258.303.000 |
| 2016 | - | US$ 2.090.378.000 |
| 2015 | - | US$ 2.155.443.000 |
| 2014 | - | US$ 2.481.853.000 |
| 2013 | - | US$ 2.550.575.000 |
| 2012 | - | US$ 2.415.083.000 |
| 2011 | - | US$ 2.410.024.000 |
| 2010 | US$ 2.465.350.000 | US$ 2.237.320.000 |
| 2009 | US$ 2.719.021.000 | US$ 2.039.974.000 |
| 2008 | US$ 3.299.992.000 | US$ 2.124.856.000 |
| 2007 | US$ 2.523.138.000 | US$ 2.166.593.000 |
| 2006 | US$ 1.997.294.000 | US$ 1.710.134.000 |
| 2005 | US$ 909.729.000 | US$ 1.648.317.000 |
| 2004 | US$ 3.407.596.000 | US$ 658.309.000 |
| 2003 | US$ 3.466.864.000 | US$ 1.209.506.000 |
| 2002 | US$ 3.723.974.000 | US$ 1.036.492.000 |
| 2001 | US$ 1.391.952.000 | US$ 1.053.056.000 |
As exportações de alimentos e produtos agrícolas da Síria são de US$ 2,47 bilhões (2010), e as de Israel, de US$ 1,5 bilhão (2025). Em 2001, as exportações da Síria foram 32% maiores: US$ 1,39 bilhão da Síria e US$ 1,05 bilhão de Israel.
As exportações de alimentos e produtos agrícolas da Síria têm sido maiores que as de Israel todos os anos desde 2006.
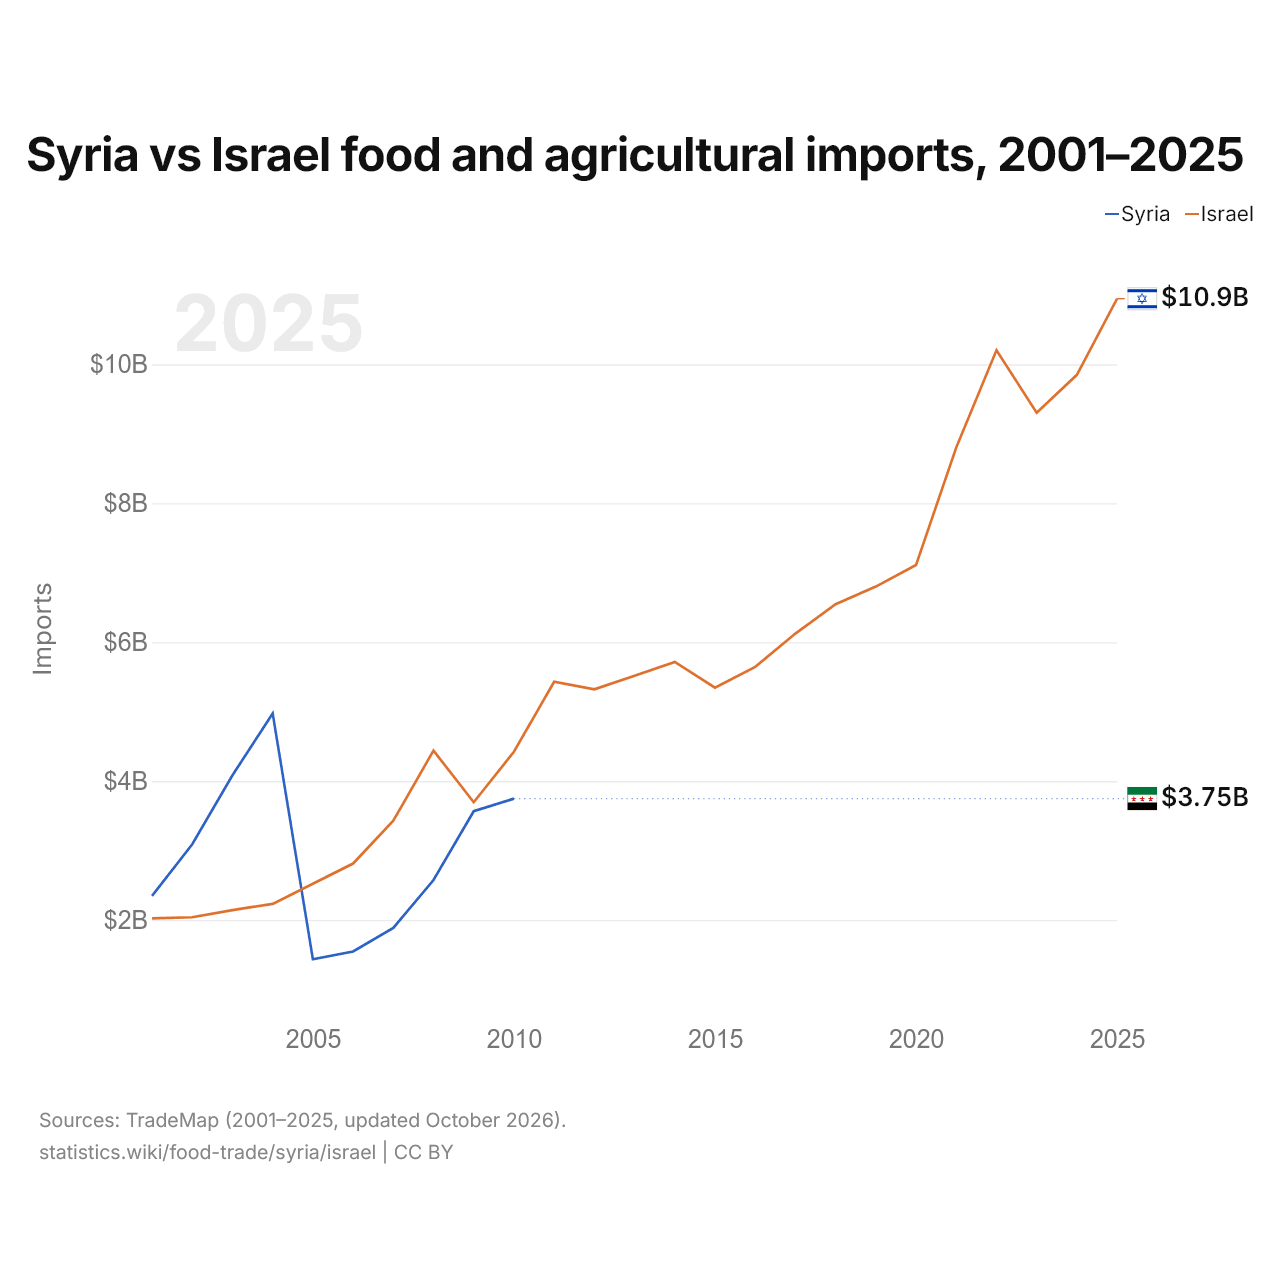
Síria vs Israel: importações de alimentos e produtos agrícolas, 2001–2025
| Ano | Importações | |
|---|---|---|
|
Síria
|
Israel
|
|
| 2025 | - | US$ 10.944.480.000 |
| 2024 | - | US$ 9.848.680.000 |
| 2023 | - | US$ 9.303.072.000 |
| 2022 | - | US$ 10.201.833.000 |
| 2021 | - | US$ 8.803.247.000 |
| 2020 | - | US$ 7.110.038.000 |
| 2019 | - | US$ 6.799.828.000 |
| 2018 | - | US$ 6.545.782.000 |
| 2017 | - | US$ 6.123.579.000 |
| 2016 | - | US$ 5.643.961.000 |
| 2015 | - | US$ 5.345.631.000 |
| 2014 | - | US$ 5.715.705.000 |
| 2013 | - | US$ 5.515.956.000 |
| 2012 | - | US$ 5.320.382.000 |
| 2011 | - | US$ 5.429.361.000 |
| 2010 | US$ 3.747.545.000 | US$ 4.422.397.000 |
| 2009 | US$ 3.565.653.000 | US$ 3.695.136.000 |
| 2008 | US$ 2.575.843.000 | US$ 4.438.780.000 |
| 2007 | US$ 1.886.675.000 | US$ 3.429.656.000 |
| 2006 | US$ 1.546.775.000 | US$ 2.812.858.000 |
| 2005 | US$ 1.434.280.000 | US$ 2.522.118.000 |
| 2004 | US$ 4.974.633.000 | US$ 2.232.576.000 |
| 2003 | US$ 4.083.473.000 | US$ 2.143.031.000 |
| 2002 | US$ 3.090.329.000 | US$ 2.039.242.000 |
| 2001 | US$ 2.347.244.000 | US$ 2.022.627.000 |
As importações de alimentos e produtos agrícolas da Síria são de US$ 3,75 bilhões (2010), e as de Israel, de US$ 10,9 bilhões (2025). Em 2001, as importações da Síria foram 16% maiores: US$ 2,35 bilhões da Síria e US$ 2,02 bilhões de Israel.
Síria vs Israel: dados do comércio de alimentos e produtos agrícolas
|
Síria
|
Israel
|
|
|---|---|---|
| Exportações | US$ 2,47 bi (2010) | US$ 1,50 bi (2025) |
| Importações | US$ 3,75 bi (2010) | US$ 10,9 bi (2025) |
| Saldo | -US$ 1,28 bi (2010) | -US$ 9,45 bi (2025) |
| Participação mundial | 0,21% | 0,07% |
| Posição mundial | n/d | 94/171 |
| Principal comprador | Iraque (47,7%, 2010) | Estados Unidos (27,4%, 2025) |
| Principal fornecedor | Brasil (15,8%, 2010) | Estados Unidos (7,14%, 2025) |
Comparar o comércio de alimentos e produtos agrícolas de 2 países quaisquer
Fontes:
- TradeMap (2001–2025, atualizado em outubro de 2026)
Creative Commons Atribuição (CC BY): você pode copiar, compartilhar, adaptar e reutilizar este conteúdo, inclusive para fins comerciais, desde que cite o statistics.wiki e indique as alterações que fizer. As fontes listadas acima podem ter suas próprias condições de licença.