
Noruega vs Alemanha: exportações de alimentos e produtos agrícolas, 2001–2025 (inclui couros e peles)
| Ano | Exportações | |
|---|---|---|
 Noruega |
 Alemanha |
|
| 2025 | US$ 18.543.561.000 | US$ 121.958.534.000 |
| 2024 | US$ 17.260.323.000 | US$ 110.074.619.000 |
| 2023 | US$ 17.384.780.000 | US$ 106.795.073.000 |
| 2022 | US$ 16.952.514.000 | US$ 100.018.714.000 |
| 2021 | US$ 15.118.280.000 | US$ 94.573.166.000 |
| 2020 | US$ 12.167.640.000 | US$ 86.054.474.000 |
| 2019 | US$ 13.079.896.000 | US$ 85.626.677.000 |
| 2018 | US$ 13.075.956.000 | US$ 87.877.027.000 |
| 2017 | US$ 12.242.870.000 | US$ 85.709.504.000 |
| 2016 | US$ 11.669.327.000 | US$ 81.030.495.000 |
| 2015 | US$ 9.938.381.000 | US$ 79.267.002.000 |
| 2014 | US$ 11.797.879.000 | US$ 93.226.099.000 |
| 2013 | US$ 11.304.969.000 | US$ 91.922.152.000 |
| 2012 | US$ 9.751.533.000 | US$ 84.442.794.000 |
| 2011 | US$ 10.241.286.000 | US$ 86.790.487.000 |
| 2010 | US$ 9.541.573.000 | US$ 73.988.669.000 |
| 2009 | US$ 7.663.967.000 | US$ 71.787.690.000 |
| 2008 | US$ 7.564.516.000 | US$ 79.962.003.000 |
| 2007 | US$ 6.933.915.000 | US$ 60.898.785.000 |
| 2006 | US$ 6.128.840.000 | US$ 52.264.324.000 |
| 2005 | US$ 5.520.599.000 | US$ 47.096.221.000 |
| 2004 | US$ 4.719.904.000 | US$ 40.440.870.000 |
| 2003 | US$ 4.147.044.000 | US$ 34.821.277.000 |
| 2002 | US$ 4.019.750.000 | US$ 30.587.926.000 |
| 2001 | US$ 3.767.868.000 | US$ 28.199.521.000 |
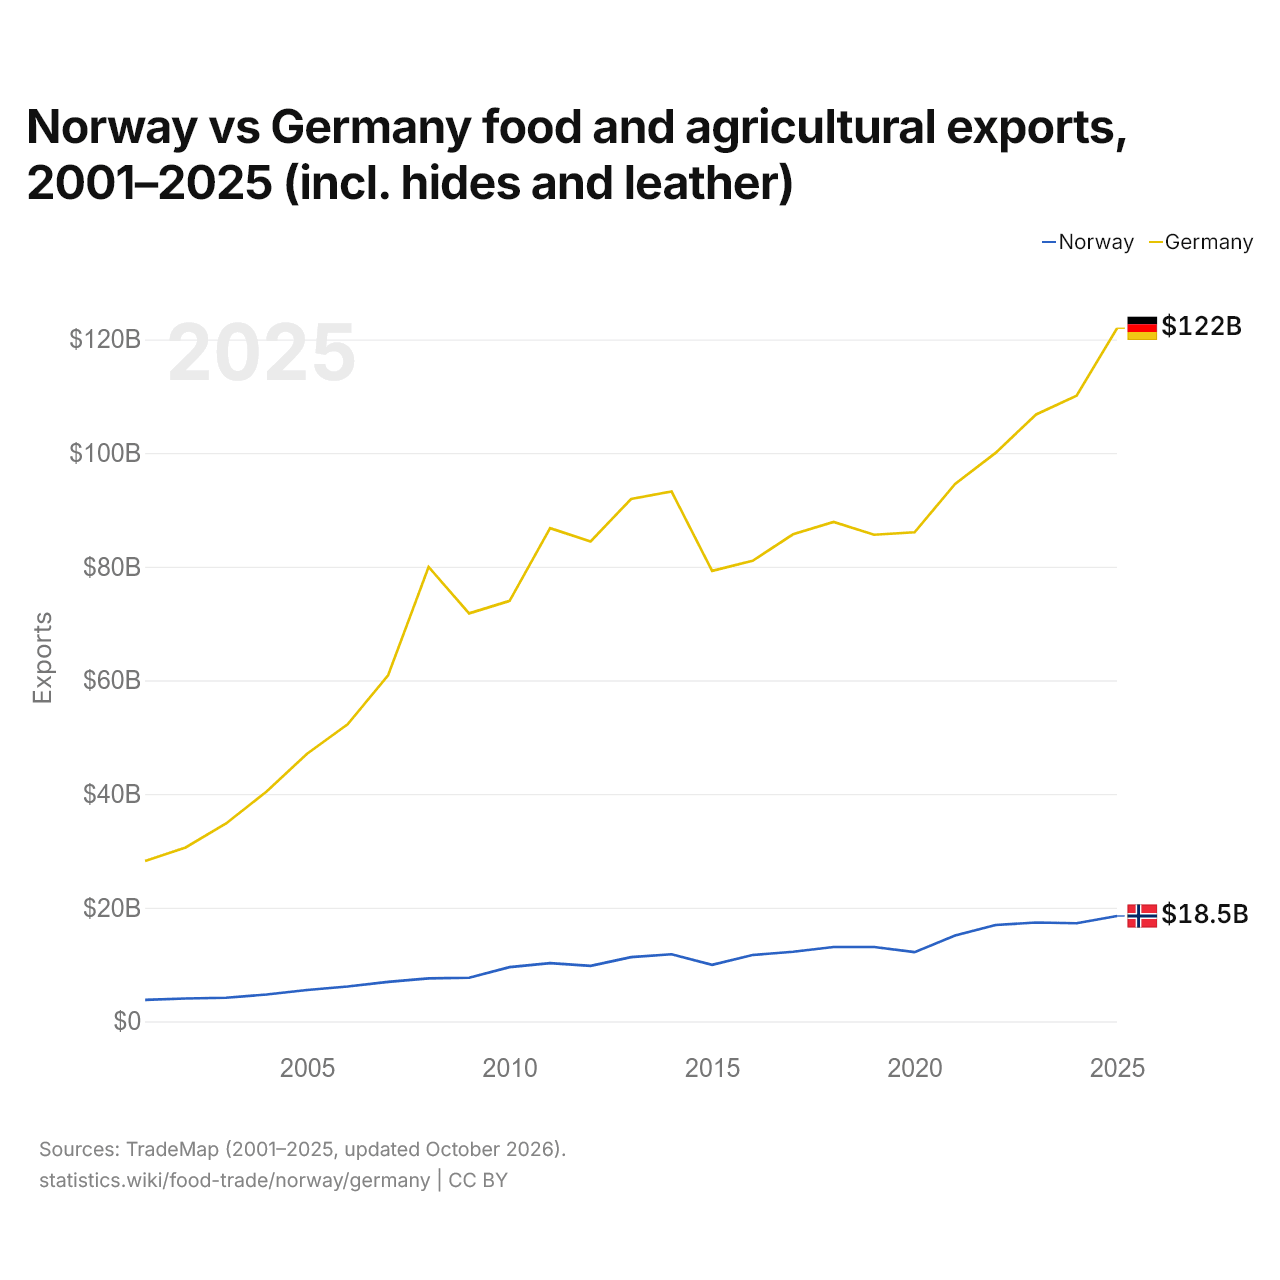
Em 2025, as exportações de alimentos e produtos agrícolas da Noruega foram de US$ 18,5 bilhões e as da Alemanha, de US$ 122 bilhões: as da Alemanha foram 6,6 vezes maiores. Em 2001, as exportações da Alemanha foram 7,5 vezes maiores: US$ 3,77 bilhões da Noruega e US$ 28,2 bilhões da Alemanha.
As exportações de alimentos e produtos agrícolas da Alemanha têm sido maiores que as da Noruega todos os anos desde 2001.
Noruega vs Alemanha: importações de alimentos e produtos agrícolas, 2001–2025
| Ano | Importações | |
|---|---|---|
|
Noruega
|
Alemanha
|
|
| 2025 | US$ 12.809.853.000 | US$ 160.723.579.000 |
| 2024 | US$ 11.635.625.000 | US$ 140.952.684.000 |
| 2023 | US$ 11.322.258.000 | US$ 134.368.583.000 |
| 2022 | US$ 11.317.502.000 | US$ 127.823.929.000 |
| 2021 | US$ 11.071.863.000 | US$ 121.000.964.000 |
| 2020 | US$ 9.359.650.000 | US$ 109.073.136.000 |
| 2019 | US$ 8.666.066.000 | US$ 105.853.066.000 |
| 2018 | US$ 8.791.693.000 | US$ 109.680.314.000 |
| 2017 | US$ 8.254.978.000 | US$ 105.416.101.000 |
| 2016 | US$ 7.952.640.000 | US$ 97.844.980.000 |
| 2015 | US$ 7.901.746.000 | US$ 94.615.216.000 |
| 2014 | US$ 9.078.473.000 | US$ 107.655.480.000 |
| 2013 | US$ 8.994.963.000 | US$ 106.055.191.000 |
| 2012 | US$ 8.455.533.000 | US$ 100.143.936.000 |
| 2011 | US$ 8.112.897.000 | US$ 104.645.498.000 |
| 2010 | US$ 6.607.713.000 | US$ 88.537.920.000 |
| 2009 | US$ 6.168.420.000 | US$ 86.260.179.000 |
| 2008 | US$ 6.910.485.000 | US$ 96.387.449.000 |
| 2007 | US$ 5.794.855.000 | US$ 74.714.353.000 |
| 2006 | US$ 4.586.262.000 | US$ 66.067.115.000 |
| 2005 | US$ 4.106.215.000 | US$ 59.690.205.000 |
| 2004 | US$ 3.778.632.000 | US$ 53.131.755.000 |
| 2003 | US$ 3.266.287.000 | US$ 48.180.846.000 |
| 2002 | US$ 2.831.572.000 | US$ 42.364.709.000 |
| 2001 | US$ 2.549.572.000 | US$ 39.735.907.000 |
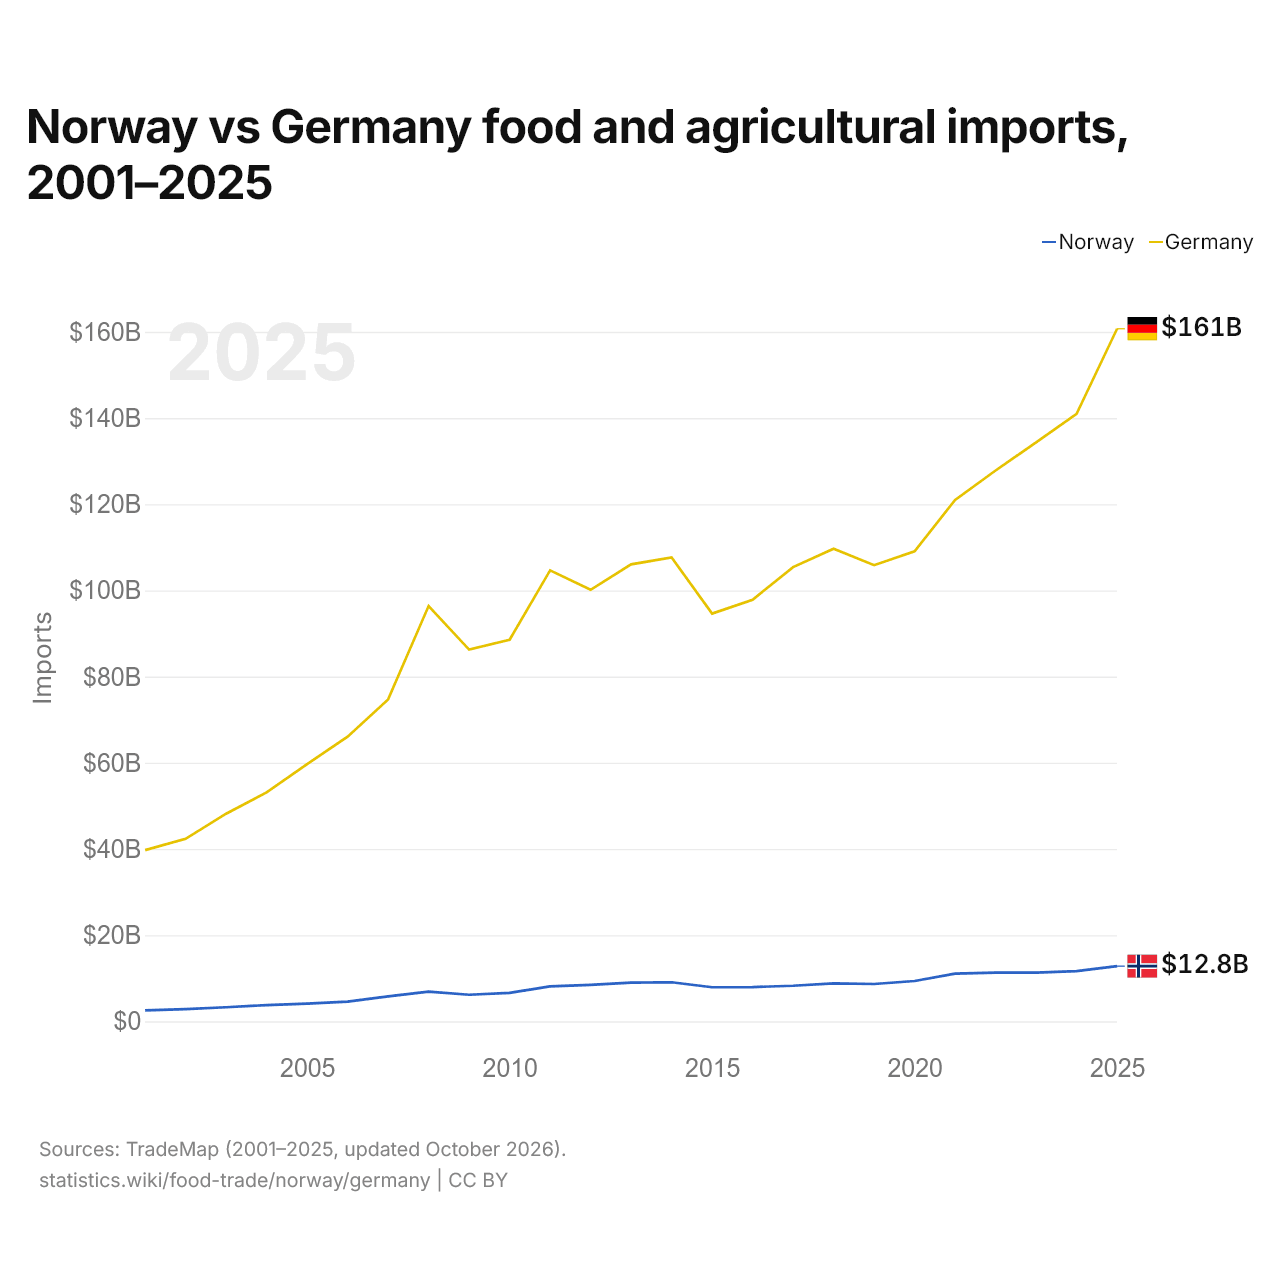
Em 2025, as importações de alimentos e produtos agrícolas da Noruega foram de US$ 12,8 bilhões e as da Alemanha, de US$ 161 bilhões: as da Alemanha foram 13 vezes maiores. Em 2001, as importações da Alemanha foram 16 vezes maiores: US$ 2,55 bilhões da Noruega e US$ 39,7 bilhões da Alemanha.
Noruega vs Alemanha: dados do comércio de alimentos e produtos agrícolas
|
Noruega
|
Alemanha
|
|
|---|---|---|
| Exportações | US$ 18,5 bi (2025) | US$ 122 bi (2025) |
| Importações | US$ 12,8 bi (2025) | US$ 161 bi (2025) |
| Saldo | +US$ 5,73 bi (2025) | -US$ 38,8 bi (2025) |
| Participação mundial | 0,83% | 5,44% |
| Posição mundial | 31/171 | 4/171 |
| Principal comprador | Polônia (10%, 2025) | Países Baixos (14,1%, 2025) |
| Principal fornecedor | Dinamarca (8,6%, 2025) | Países Baixos (18%, 2025) |
Comparar o comércio de alimentos e produtos agrícolas de 2 países quaisquer
Fontes:
- TradeMap (2001–2025, atualizado em outubro de 2026)
Creative Commons Atribuição (CC BY): você pode copiar, compartilhar, adaptar e reutilizar este conteúdo, inclusive para fins comerciais, desde que cite o statistics.wiki e indique as alterações que fizer. As fontes listadas acima podem ter suas próprias condições de licença.