
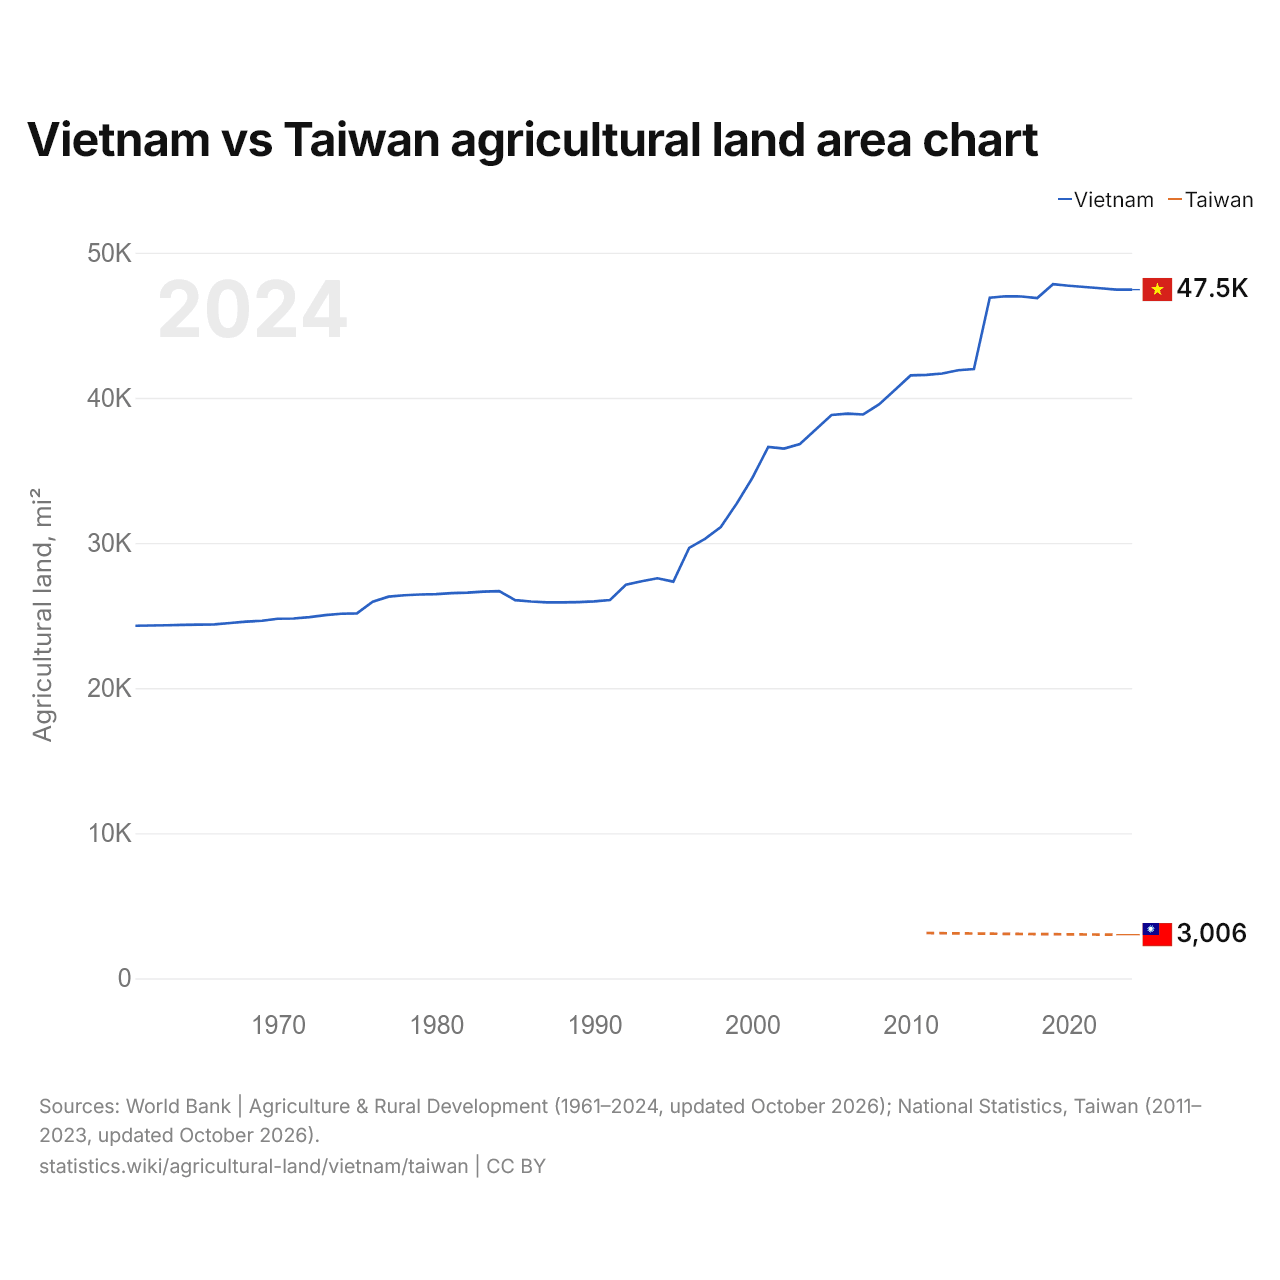
Vietnã vs Taiwan: gráfico da área de terras agrícolas
1x
| Ano | Terras agrícolas, km² | |
|---|---|---|
| Vietnã | Taiwan | |
| 2024 | 122.910 | - |
| 2023 | 122.910 | 7.785 |
| 2022 | 123.150 | - |
| 2021 | 123.375 | - |
| 2020 | 123.600 | - |
| 2019 | 123.880 | - |
| 2018 | 121.405 | - |
| 2017 | 121.688 | - |
| 2016 | 121.722 | - |
| 2015 | 121.478 | 7.966 |
| 2014 | 108.737 | - |
| 2013 | 108.528 | - |
| 2012 | 107.933 | - |
| 2011 | 107.686 | 8.083 |
| 2010 | 107.601 | - |
| 2009 | 105.005 | - |
| 2008 | 102.408 | - |
| 2007 | 100.626 | - |
| 2006 | 100.780 | - |
| 2005 | 100.541 | - |
| 2004 | 97.956 | - |
| 2003 | 95.370 | - |
| 2002 | 94.550 | - |
| 2001 | 94.830 | - |
| 2000 | 89.337 | - |
| 1999 | 84.713 | - |
| 1998 | 80.550 | - |
| 1997 | 78.440 | - |
| 1996 | 76.820 | - |
| 1995 | 70.790 | - |
| 1994 | 71.400 | - |
| 1993 | 70.870 | - |
| 1992 | 70.250 | - |
| 1991 | 67.510 | - |
| 1990 | 67.260 | - |
| 1989 | 67.150 | - |
| 1988 | 67.100 | - |
| 1987 | 67.100 | - |
| 1986 | 67.250 | - |
| 1985 | 67.500 | - |
| 1984 | 69.100 | - |
| 1983 | 69.020 | - |
| 1982 | 68.840 | - |
| 1981 | 68.760 | - |
| 1980 | 68.580 | - |
| 1979 | 68.500 | - |
| 1978 | 68.360 | - |
| 1977 | 68.120 | - |
| 1976 | 67.220 | - |
| 1975 | 65.120 | - |
| 1974 | 65.070 | - |
| 1973 | 64.820 | - |
| 1972 | 64.470 | - |
| 1971 | 64.220 | - |
| 1970 | 64.170 | - |
| 1969 | 63.820 | - |
| 1968 | 63.670 | - |
| 1967 | 63.420 | - |
| 1966 | 63.170 | - |
| 1965 | 63.120 | - |
| 1964 | 63.070 | - |
| 1963 | 63.020 | - |
| 1962 | 62.970 | - |
| 1961 | 62.920 | - |
As terras agrícolas ocupavam 122.910 km² (47.456 mi²) no Vietnã e 7.785 km² (3.006 mi²) em Taiwan: a área agrícola do Vietnã era 16 vezes a de Taiwan. Em 2011, ocupavam 107.686 km² (41.578 mi²) no Vietnã e 8.083 km² (3.121 mi²) em Taiwan; a área agrícola do Vietnã era então 13 vezes a de Taiwan.
Vietnã vs Taiwan: terras agrícolas, área e % da área terrestre
 Vietnã |
 Taiwan |
|
|---|---|---|
| Terras agrícolas | 122.910 km² | 7.785 km² (2023) |
| Terras agrícolas, % | 39,2% | 21,5% (2023) |
| Terras aráveis | 67.285 km² | n/d |
| Terras aráveis, % | 21,5% | n/d |
| Culturas permanentes | 49.206 km² | 2.513 km² (2023) |
| Culturas permanentes, % | 15,7% | 6,9% (2023) |
| Prados e pastagens | 6.420 km² | n/d |
| Prados e pastagens, % | 2,0% | n/d |
| Terras aráveis por pessoa | 0,07 ha por pessoa | n/d |
| Posição mundial por terras agrícolas | 67º de 194 | 143º de 194 |
| Posição mundial por terras aráveis | 38º de 191 | n/d |
| Posição mundial por terras aráveis por pessoa | 136º de 191 | n/d |
Comparar as terras agrícolas de 2 países quaisquer
Fontes:
- Banco Mundial | Agriculture & Rural Development (1961–2024, atualizado em outubro de 2026)
- National Statistics, Taiwan (2011–2023, atualizado em outubro de 2026)
Creative Commons Atribuição (CC BY): você pode copiar, compartilhar, adaptar e reutilizar este conteúdo, inclusive para fins comerciais, desde que cite o statistics.wiki e indique as alterações que fizer. As fontes listadas acima podem ter suas próprias condições de licença.