
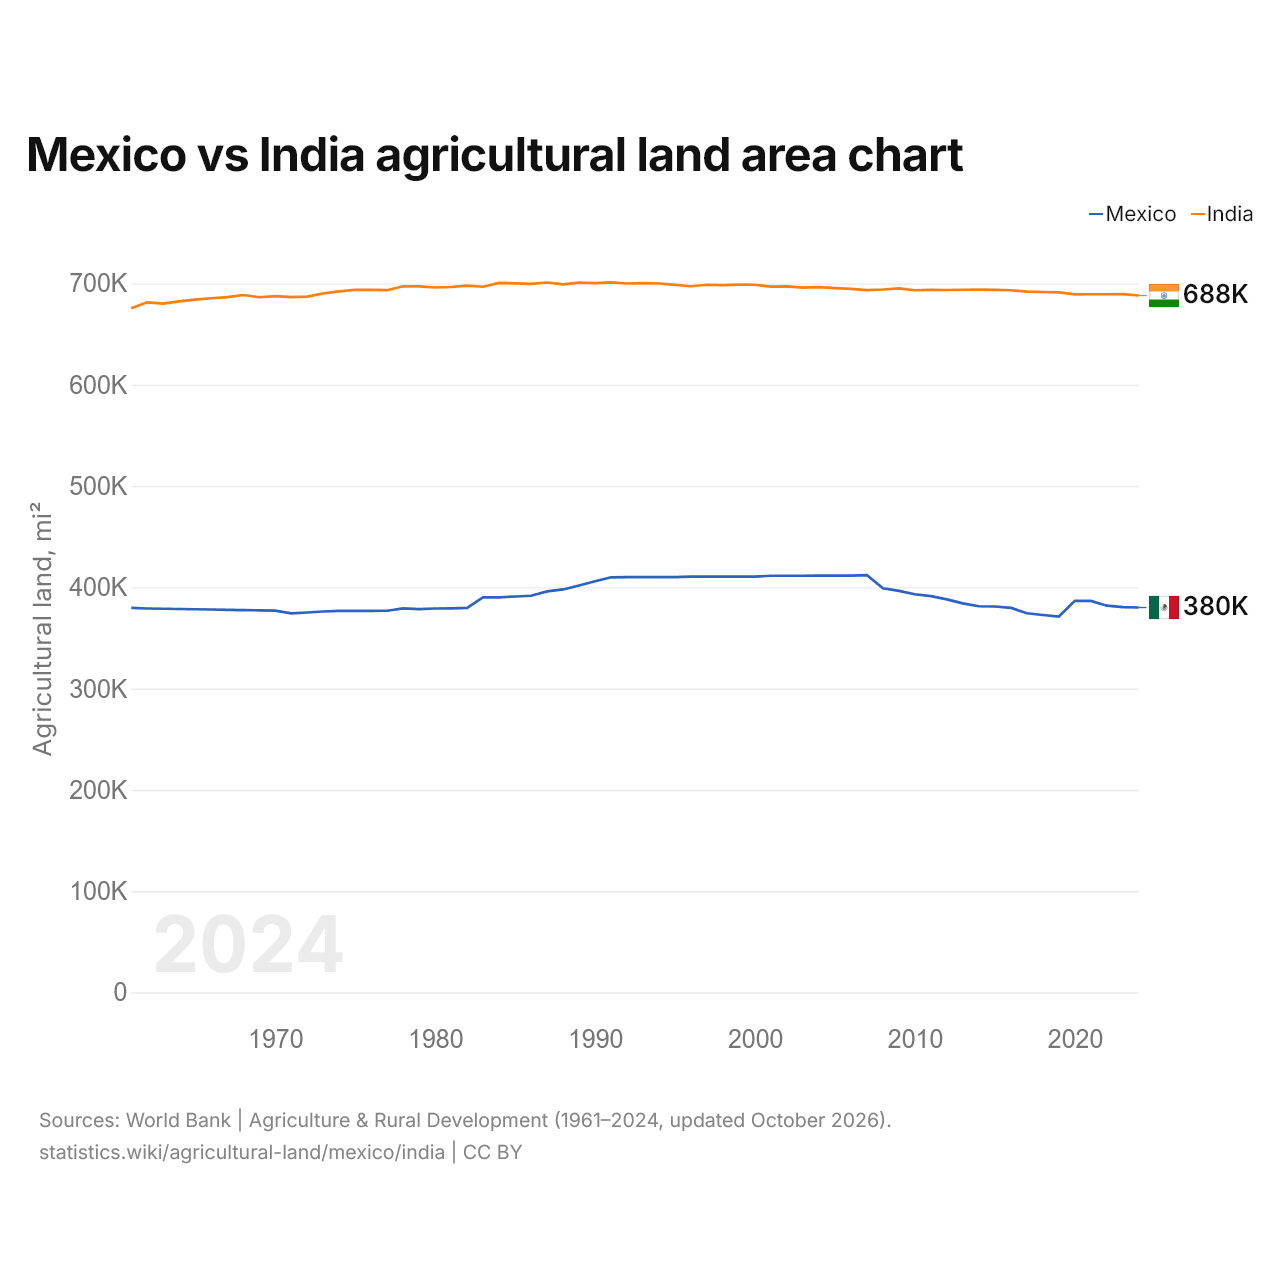
México vs Índia: gráfico da área de terras agrícolas
| Ano | Terras agrícolas, km² | |
|---|---|---|
| México | Índia | |
| 2024 | 984.296 | 1.782.200 |
| 2023 | 985.454 | 1.785.710 |
| 2022 | 988.890 | 1.785.567 |
| 2021 | 1.001.259 | 1.785.423 |
| 2020 | 1.001.425 | 1.785.280 |
| 2019 | 961.060 | 1.790.450 |
| 2018 | 965.160 | 1.791.160 |
| 2017 | 969.460 | 1.792.360 |
| 2016 | 983.380 | 1.795.780 |
| 2015 | 986.800 | 1.796.750 |
| 2014 | 987.480 | 1.797.280 |
| 2013 | 994.860 | 1.796.980 |
| 2012 | 1.005.120 | 1.796.420 |
| 2011 | 1.013.220 | 1.796.700 |
| 2010 | 1.018.070 | 1.795.730 |
| 2009 | 1.026.820 | 1.800.680 |
| 2008 | 1.033.550 | 1.797.570 |
| 2007 | 1.067.000 | 1.796.200 |
| 2006 | 1.065.700 | 1.799.060 |
| 2005 | 1.065.700 | 1.801.260 |
| 2004 | 1.065.700 | 1.803.750 |
| 2003 | 1.065.500 | 1.802.490 |
| 2002 | 1.065.500 | 1.805.600 |
| 2001 | 1.065.500 | 1.804.870 |
| 2000 | 1.063.300 | 1.809.750 |
| 1999 | 1.063.260 | 1.810.210 |
| 1998 | 1.063.250 | 1.808.740 |
| 1997 | 1.063.100 | 1.809.810 |
| 1996 | 1.063.100 | 1.805.890 |
| 1995 | 1.061.950 | 1.809.450 |
| 1994 | 1.061.900 | 1.812.910 |
| 1993 | 1.061.800 | 1.813.820 |
| 1992 | 1.061.770 | 1.813.050 |
| 1991 | 1.061.540 | 1.815.860 |
| 1990 | 1.051.510 | 1.814.130 |
| 1989 | 1.040.500 | 1.815.010 |
| 1988 | 1.030.510 | 1.810.910 |
| 1987 | 1.025.500 | 1.815.430 |
| 1986 | 1.014.410 | 1.811.920 |
| 1985 | 1.012.355 | 1.813.400 |
| 1984 | 1.010.310 | 1.814.520 |
| 1983 | 1.010.200 | 1.804.620 |
| 1982 | 983.150 | 1.807.710 |
| 1981 | 982.100 | 1.804.010 |
| 1980 | 981.800 | 1.802.720 |
| 1979 | 979.980 | 1.805.800 |
| 1978 | 981.980 | 1.805.920 |
| 1977 | 976.010 | 1.795.910 |
| 1976 | 975.510 | 1.796.490 |
| 1975 | 975.510 | 1.796.940 |
| 1974 | 975.510 | 1.792.820 |
| 1973 | 974.000 | 1.787.510 |
| 1972 | 971.500 | 1.779.460 |
| 1971 | 969.380 | 1.778.170 |
| 1970 | 976.350 | 1.780.520 |
| 1969 | 977.090 | 1.777.920 |
| 1968 | 977.690 | 1.783.640 |
| 1967 | 978.390 | 1.778.070 |
| 1966 | 979.140 | 1.775.300 |
| 1965 | 979.790 | 1.771.770 |
| 1964 | 980.490 | 1.767.120 |
| 1963 | 981.090 | 1.761.540 |
| 1962 | 981.790 | 1.764.820 |
| 1961 | 983.160 | 1.749.520 |
As terras agrícolas ocupam 984.296 km² (380.039 mi²) no México e 1.782.200 km² (688.111 mi²) na Índia: a área agrícola da Índia é 1,8 vezes a do México. Em 1961, ocupavam 983.160 km² (379.600 mi²) no México e 1.749.520 km² (675.493 mi²) na Índia; a área agrícola da Índia era então 1,8 vezes a do México.
As terras agrícolas ocupam 50,6% da área terrestre do México e 59,9% da área da Índia; as terras aráveis, 10,3% e 51,7%.
México vs Índia: terras agrícolas, área e % da área terrestre
 México |
 Índia |
|
|---|---|---|
| Terras agrícolas | 984.296 km² | 1.782.200 km² |
| Terras agrícolas, % | 50,6% | 59,9% |
| Terras aráveis | 200.008 km² | 1.538.097 km² |
| Terras aráveis, % | 10,3% | 51,7% |
| Culturas permanentes | 43.929 km² | 142.003 km² |
| Culturas permanentes, % | 2,3% | 4,8% |
| Prados e pastagens | 740.359 km² | 102.100 km² |
| Prados e pastagens, % | 38,1% | 3,4% |
| Terras aráveis por pessoa | 0,15 ha por pessoa | 0,11 ha por pessoa |
| Posição mundial por terras agrícolas | 11º de 194 | 7º de 194 |
| Posição mundial por terras aráveis | 15º de 191 | 1º de 191 |
| Posição mundial por terras aráveis por pessoa | 81º de 191 | 106º de 191 |
Comparar as terras agrícolas de 2 países quaisquer
Fontes:
- Banco Mundial | Agriculture & Rural Development (1961–2024, atualizado em outubro de 2026)
Creative Commons Atribuição (CC BY): você pode copiar, compartilhar, adaptar e reutilizar este conteúdo, inclusive para fins comerciais, desde que cite o statistics.wiki e indique as alterações que fizer. As fontes listadas acima podem ter suas próprias condições de licença.