
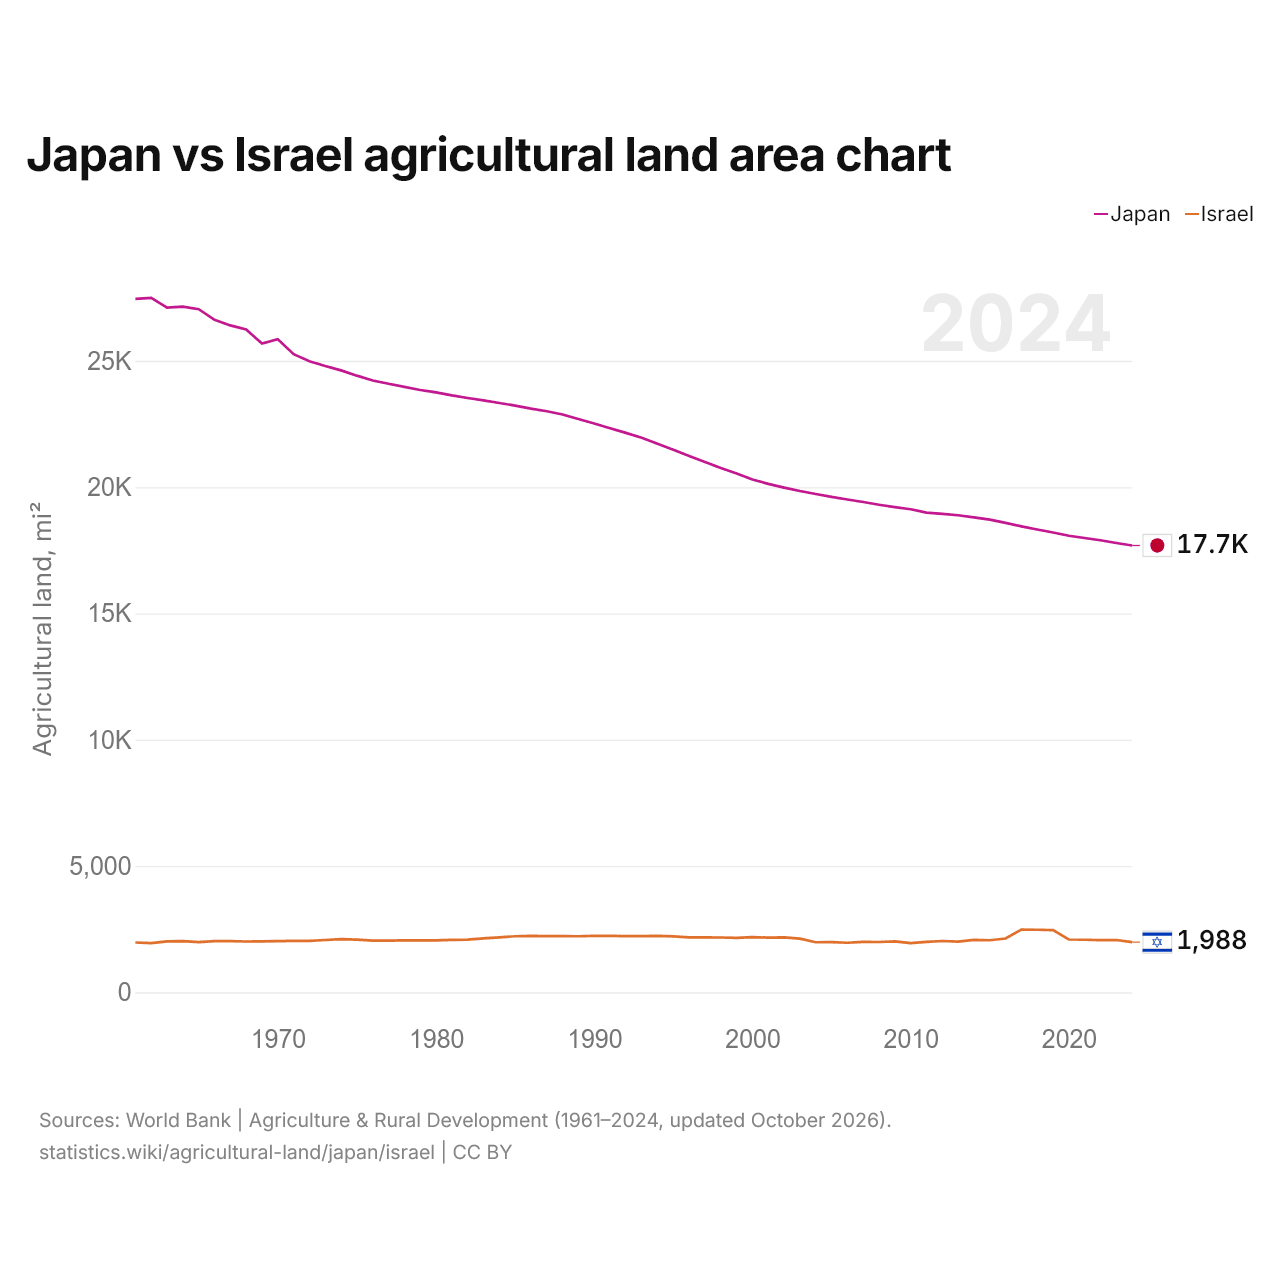
Japão vs Israel: gráfico da área de terras agrícolas
1x
| Ano | Terras agrícolas, km² | |
|---|---|---|
| Japão | Israel | |
| 2024 | 45.820 | 5.149 |
| 2023 | 46.070 | 5.367 |
| 2022 | 46.350 | 5.346 |
| 2021 | 46.590 | 5.390 |
| 2020 | 46.820 | 5.418 |
| 2019 | 47.150 | 6.384 |
| 2018 | 47.460 | 6.413 |
| 2017 | 47.780 | 6.440 |
| 2016 | 48.130 | 5.520 |
| 2015 | 48.460 | 5.339 |
| 2014 | 48.700 | 5.377 |
| 2013 | 48.920 | 5.203 |
| 2012 | 49.050 | 5.262 |
| 2011 | 49.190 | 5.170 |
| 2010 | 49.530 | 5.045 |
| 2009 | 49.746 | 5.226 |
| 2008 | 49.992 | 5.156 |
| 2007 | 50.268 | 5.181 |
| 2006 | 50.534 | 5.088 |
| 2005 | 50.800 | 5.145 |
| 2004 | 51.100 | 5.135 |
| 2003 | 51.400 | 5.510 |
| 2002 | 51.750 | 5.630 |
| 2001 | 52.130 | 5.610 |
| 2000 | 52.580 | 5.660 |
| 1999 | 53.210 | 5.590 |
| 1998 | 53.760 | 5.620 |
| 1997 | 54.370 | 5.630 |
| 1996 | 55.000 | 5.640 |
| 1995 | 55.620 | 5.730 |
| 1994 | 56.250 | 5.790 |
| 1993 | 56.860 | 5.770 |
| 1992 | 57.360 | 5.770 |
| 1991 | 57.840 | 5.780 |
| 1990 | 58.320 | 5.790 |
| 1989 | 58.780 | 5.750 |
| 1988 | 59.250 | 5.760 |
| 1987 | 59.580 | 5.770 |
| 1986 | 59.850 | 5.790 |
| 1985 | 60.160 | 5.750 |
| 1984 | 60.430 | 5.640 |
| 1983 | 60.690 | 5.530 |
| 1982 | 60.940 | 5.400 |
| 1981 | 61.210 | 5.380 |
| 1980 | 61.520 | 5.330 |
| 1979 | 61.760 | 5.330 |
| 1978 | 62.080 | 5.330 |
| 1977 | 62.400 | 5.310 |
| 1976 | 62.730 | 5.300 |
| 1975 | 63.230 | 5.400 |
| 1974 | 63.770 | 5.450 |
| 1973 | 64.220 | 5.370 |
| 1972 | 64.710 | 5.270 |
| 1971 | 65.430 | 5.270 |
| 1970 | 66.960 | 5.250 |
| 1969 | 66.520 | 5.230 |
| 1968 | 67.970 | 5.210 |
| 1967 | 68.380 | 5.250 |
| 1966 | 68.960 | 5.250 |
| 1965 | 70.040 | 5.140 |
| 1964 | 70.300 | 5.250 |
| 1963 | 70.200 | 5.220 |
| 1962 | 71.200 | 5.050 |
| 1961 | 71.100 | 5.110 |
As terras agrícolas ocupam 45.820 km² (17.691 mi²) no Japão e 5.149 km² (1.988 mi²) em Israel: a área agrícola do Japão é 8,9 vezes a de Israel. Em 1961, ocupavam 71.100 km² (27.452 mi²) no Japão e 5.110 km² (1.973 mi²) em Israel; a área agrícola do Japão era então 14 vezes a de Israel.
As terras agrícolas ocupam 12,6% da área terrestre do Japão e 23,8% da área de Israel; as terras aráveis, 11,0% e 11,9%.
Japão vs Israel: terras agrícolas, área e % da área terrestre
 Japão |
 Israel |
|
|---|---|---|
| Terras agrícolas | 45.820 km² | 5.149 km² |
| Terras agrícolas, % | 12,6% | 23,8% |
| Terras aráveis | 40.230 km² | 2.574 km² |
| Terras aráveis, % | 11,0% | 11,9% |
| Culturas permanentes | 2.490 km² | 949 km² |
| Culturas permanentes, % | 0,7% | 4,4% |
| Prados e pastagens | 3.100 km² | 1.626 km² |
| Prados e pastagens, % | 0,9% | 7,5% |
| Terras aráveis por pessoa | 0,03 ha por pessoa | 0,03 ha por pessoa |
| Posição mundial por terras agrícolas | 92º de 194 | 149º de 194 |
| Posição mundial por terras aráveis | 58º de 191 | 138º de 191 |
| Posição mundial por terras aráveis por pessoa | 156º de 191 | 162º de 191 |
Comparar as terras agrícolas de 2 países quaisquer
Fontes:
- Banco Mundial | Agriculture & Rural Development (1961–2024, atualizado em outubro de 2026)
Creative Commons Atribuição (CC BY): você pode copiar, compartilhar, adaptar e reutilizar este conteúdo, inclusive para fins comerciais, desde que cite o statistics.wiki e indique as alterações que fizer. As fontes listadas acima podem ter suas próprias condições de licença.