
Jordan births and deaths chart
| Year | People | ||
|---|---|---|---|
| Births | Deaths | Births minus deaths | |
| 2024 | 236,279 | 36,056 | 200,223 |
| 2023 | 235,773 | 34,878 | 200,895 |
| 2022 | 235,503 | 35,603 | 199,900 |
| 2021 | 235,812 | 45,017 | 190,795 |
| 2020 | 236,057 | 37,919 | 198,138 |
| 2019 | 237,300 | 32,367 | 204,933 |
| 2018 | 237,253 | 31,920 | 205,333 |
| 2017 | 237,608 | 31,705 | 205,903 |
| 2016 | 237,631 | 31,740 | 205,891 |
| 2015 | 225,761 | 30,266 | 195,495 |
| 2014 | 213,849 | 29,680 | 184,169 |
| 2013 | 199,203 | 28,730 | 170,473 |
| 2012 | 204,055 | 28,618 | 175,437 |
| 2011 | 204,948 | 27,872 | 177,076 |
| 2010 | 204,827 | 27,079 | 177,748 |
| 2009 | 204,025 | 26,374 | 177,651 |
| 2008 | 200,658 | 25,610 | 175,048 |
| 2007 | 192,452 | 24,878 | 167,574 |
| 2006 | 170,048 | 22,405 | 147,643 |
| 2005 | 163,739 | 21,923 | 141,816 |
| 2004 | 163,186 | 21,434 | 141,752 |
| 2003 | 163,498 | 21,055 | 142,443 |
| 2002 | 159,939 | 20,689 | 139,250 |
| 2001 | 156,806 | 20,356 | 136,450 |
| 2000 | 156,512 | 20,098 | 136,414 |
| 1999 | 158,061 | 19,860 | 138,201 |
| 1998 | 160,397 | 19,701 | 140,696 |
| 1997 | 164,907 | 19,549 | 145,358 |
| 1996 | 167,187 | 19,335 | 147,852 |
| 1995 | 166,584 | 18,932 | 147,652 |
| 1994 | 162,554 | 18,355 | 144,199 |
| 1993 | 157,159 | 17,692 | 139,467 |
| 1992 | 151,271 | 17,030 | 134,241 |
| 1991 | 146,042 | 16,400 | 129,642 |
| 1990 | 129,910 | 14,998 | 114,912 |
| 1989 | 127,265 | 14,657 | 112,608 |
| 1988 | 124,129 | 14,375 | 109,754 |
| 1987 | 120,692 | 14,156 | 106,536 |
| 1986 | 117,530 | 13,979 | 103,551 |
| 1985 | 113,625 | 13,824 | 99,801 |
| 1984 | 109,784 | 13,692 | 96,092 |
| 1983 | 106,485 | 13,622 | 92,863 |
| 1982 | 103,027 | 13,554 | 89,473 |
| 1981 | 100,306 | 13,555 | 86,751 |
| 1980 | 98,096 | 13,588 | 84,508 |
| 1979 | 95,746 | 13,670 | 82,076 |
| 1978 | 93,705 | 13,797 | 79,908 |
| 1977 | 92,066 | 13,965 | 78,101 |
| 1976 | 90,119 | 14,138 | 75,981 |
| 1975 | 88,731 | 14,339 | 74,392 |
| 1974 | 86,732 | 14,520 | 72,212 |
| 1973 | 84,736 | 14,678 | 70,058 |
| 1972 | 82,524 | 14,817 | 67,707 |
| 1971 | 79,684 | 14,921 | 64,763 |
| 1970 | 76,079 | 15,758 | 60,321 |
| 1969 | 71,966 | 14,535 | 57,431 |
| 1968 | 67,520 | 14,184 | 53,336 |
| 1967 | 62,589 | 13,798 | 48,791 |
| 1966 | 58,364 | 13,784 | 44,580 |
| 1965 | 54,952 | 13,317 | 41,635 |
| 1964 | 52,488 | 13,283 | 39,205 |
| 1963 | 50,243 | 13,385 | 36,858 |
| 1962 | 47,989 | 13,391 | 34,598 |
| 1961 | 45,525 | 13,382 | 32,143 |
| 1960 | 42,796 | 13,305 | 29,491 |
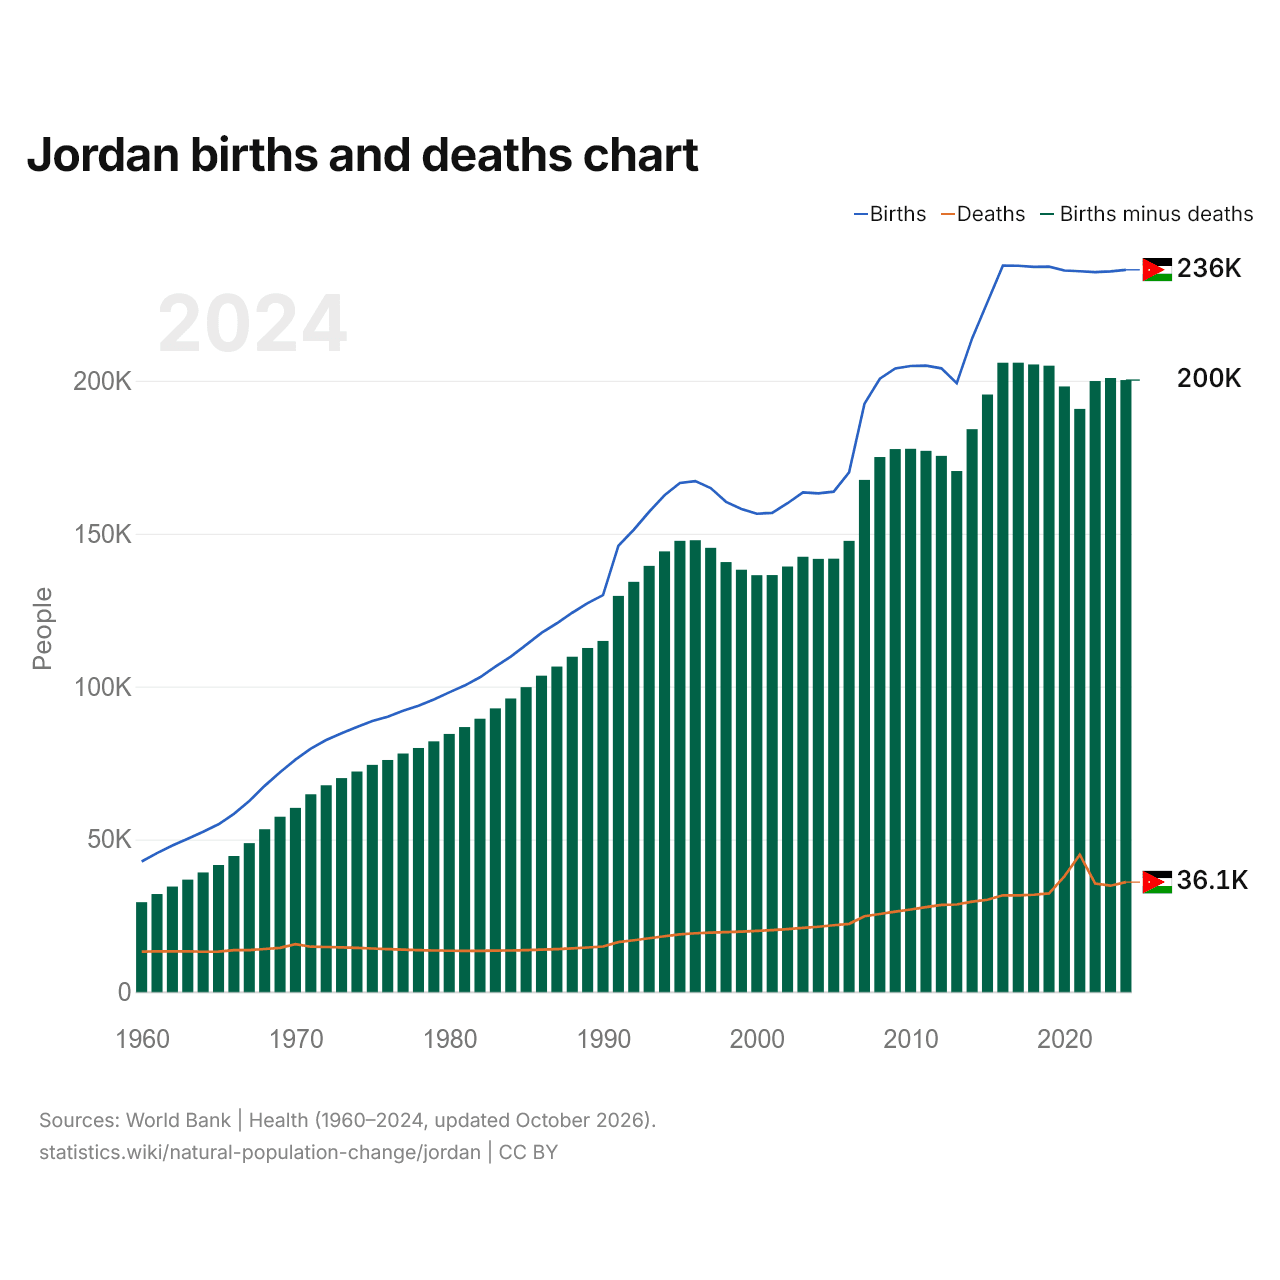
Jordan's births and deaths are 236,279 and 36,056 a year: 200,223 more births than deaths. In Jordan, births have outnumbered deaths every year since 1960. Births in Jordan peaked at 237,631 in 2016.
The largest excess of births over deaths in Jordan was 205,903, in 2017. Deaths in Jordan were highest in 2021, at 45,017.
Jordan births minus deaths per 1,000 people
| Year | Per 1,000 people | World rank |
|---|---|---|
| Jordan | ||
| 2024 | 17.3 | #56 |
| 2023 | 17.6 | #56 |
| 2022 | 17.8 | #56 |
| 2021 | 17.2 | #56 |
| 2020 | 18.2 | #57 |
| 2019 | 19.2 | #55 |
| 2018 | 19.6 | #54 |
| 2017 | 20.1 | #56 |
| 2016 | 20.6 | #57 |
| 2015 | 20.5 | #59 |
| 2014 | 20.9 | #59 |
| 2013 | 21.3 | #56 |
| 2012 | 23.1 | #52 |
| 2011 | 23.7 | #52 |
| 2010 | 24.4 | #52 |
| 2009 | 24.9 | #48 |
| 2008 | 25 | #48 |
| 2007 | 24.5 | #48 |
| 2006 | 23 | #56 |
| 2005 | 23.5 | #55 |
| 2004 | 24.1 | #53 |
| 2003 | 24.8 | #52 |
| 2002 | 24.8 | #52 |
| 2001 | 24.8 | #53 |
| 2000 | 25.3 | #50 |
| 1999 | 26.2 | #43 |
| 1998 | 27.2 | #35 |
| 1997 | 28.8 | #28 |
| 1996 | 30.1 | #22 |
| 1995 | 31.1 | #17 |
| 1994 | 31.6 | #14 |
| 1993 | 32.1 | #11 |
| 1992 | 32.5 | #7 |
| 1991 | 33.1 | #8 |
| 1990 | 31.7 | #22 |
| 1989 | 33.6 | #9 |
| 1988 | 34.4 | #8 |
| 1987 | 35 | #10 |
| 1986 | 35.6 | #8 |
| 1985 | 35.9 | #8 |
| 1984 | 36.2 | #8 |
| 1983 | 36.6 | #7 |
| 1982 | 36.9 | #7 |
| 1981 | 37.3 | #7 |
| 1980 | 37.8 | #6 |
| 1979 | 38.1 | #6 |
| 1978 | 38.4 | #5 |
| 1977 | 38.7 | #2 |
| 1976 | 38.8 | #2 |
| 1975 | 39.2 | #2 |
| 1974 | 39.3 | #2 |
| 1973 | 39.4 | #1 |
| 1972 | 39.5 | #1 |
| 1971 | 39.4 | #1 |
| 1970 | 38.5 | #2 |
| 1969 | 39 | #2 |
| 1968 | 38.9 | #2 |
| 1967 | 38.4 | #3 |
| 1966 | 37.8 | #3 |
| 1965 | 37.9 | #3 |
| 1964 | 37.9 | #2 |
| 1963 | 37.4 | #2 |
| 1962 | 36.8 | #4 |
| 1961 | 35.8 | #6 |
| 1960 | 34.6 | #12 |
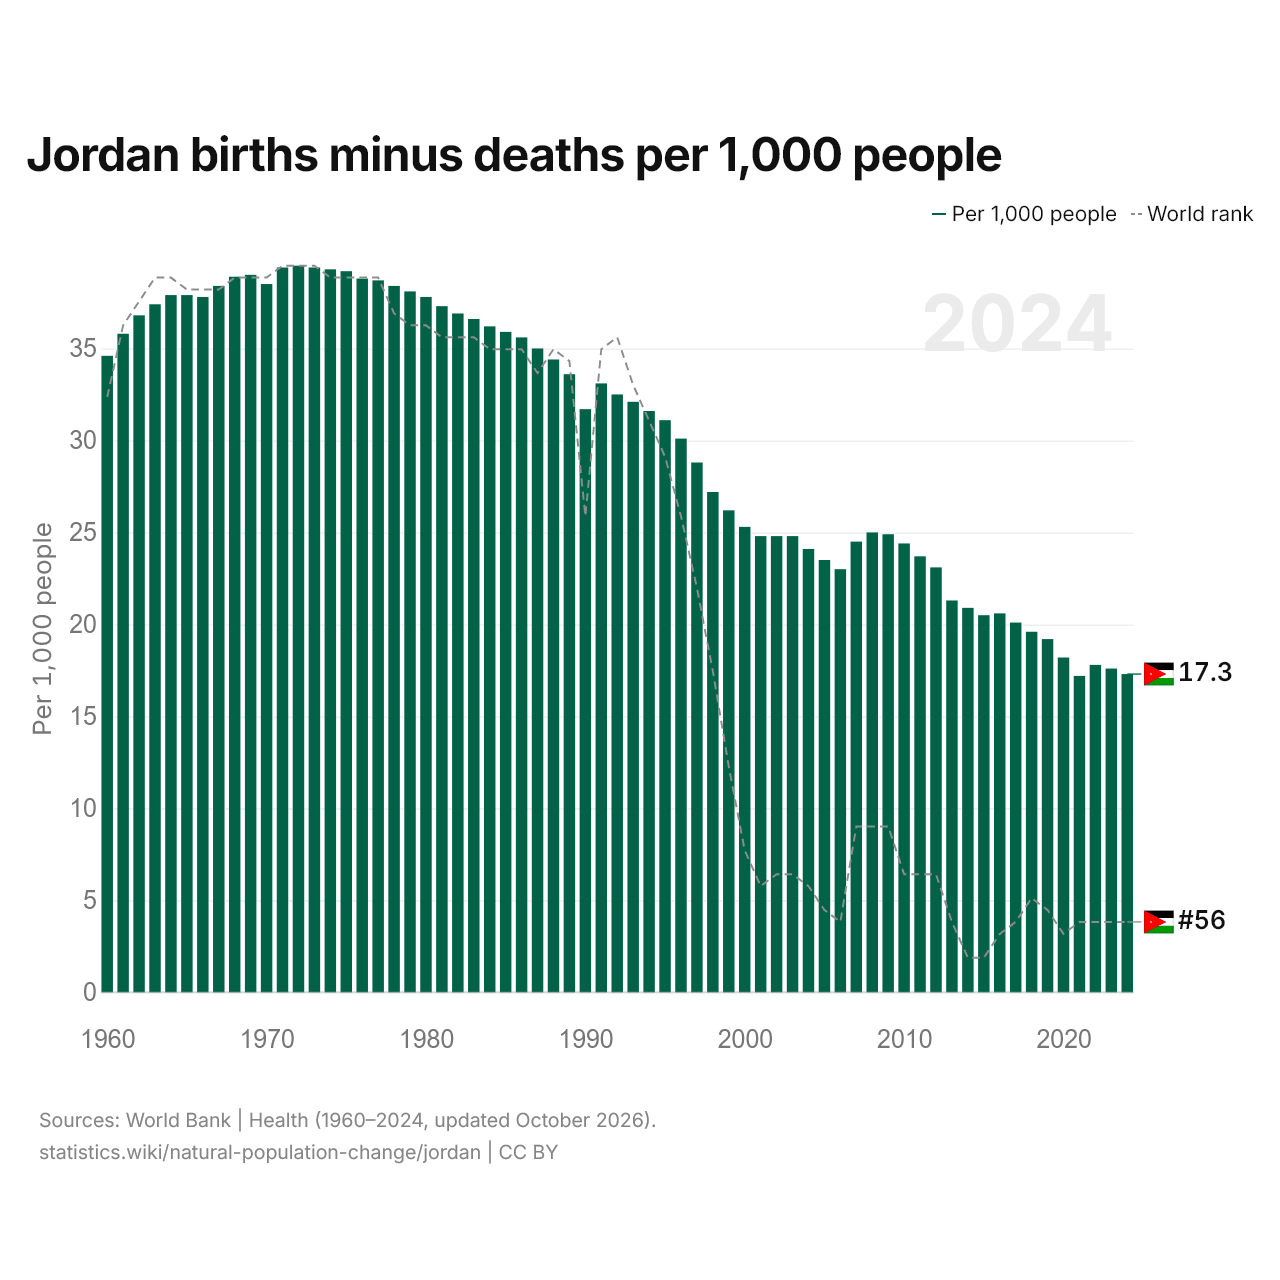
Per 1,000 people, Jordan has 17.3 more births than deaths, compared with 34.6 more births in 1960. It ranks 56th in the world, a rank it has held since 2021. Its highest rank was 1st, last held in 1973.
Jordan's rate per 1,000 people is the 9th highest of the 48 countries of Asia, where it ranges from Japan's 7.6 more deaths than births to Yemen's 29.6 more births than deaths.
Jordan births minus deaths
| Births minus deaths | +200,223 |
|---|---|
| Per 1,000 people | +17.3 |
| World rank | 56/196 |
| Yearly average, 2020–2024 | +197,990 |
| Yearly average, 2015–2024 | +200,751 |
Jordan in the world ranking by births minus deaths







Compare Jordan births minus deaths with other countries
Sources:
- World Bank | Health (1960–2024, updated October 2026)
Creative Commons Attribution (CC BY): you may copy, share, adapt and reuse this content, also commercially, as long as you credit statistics.wiki and note any changes you made. The sources listed above may have their own license terms.