
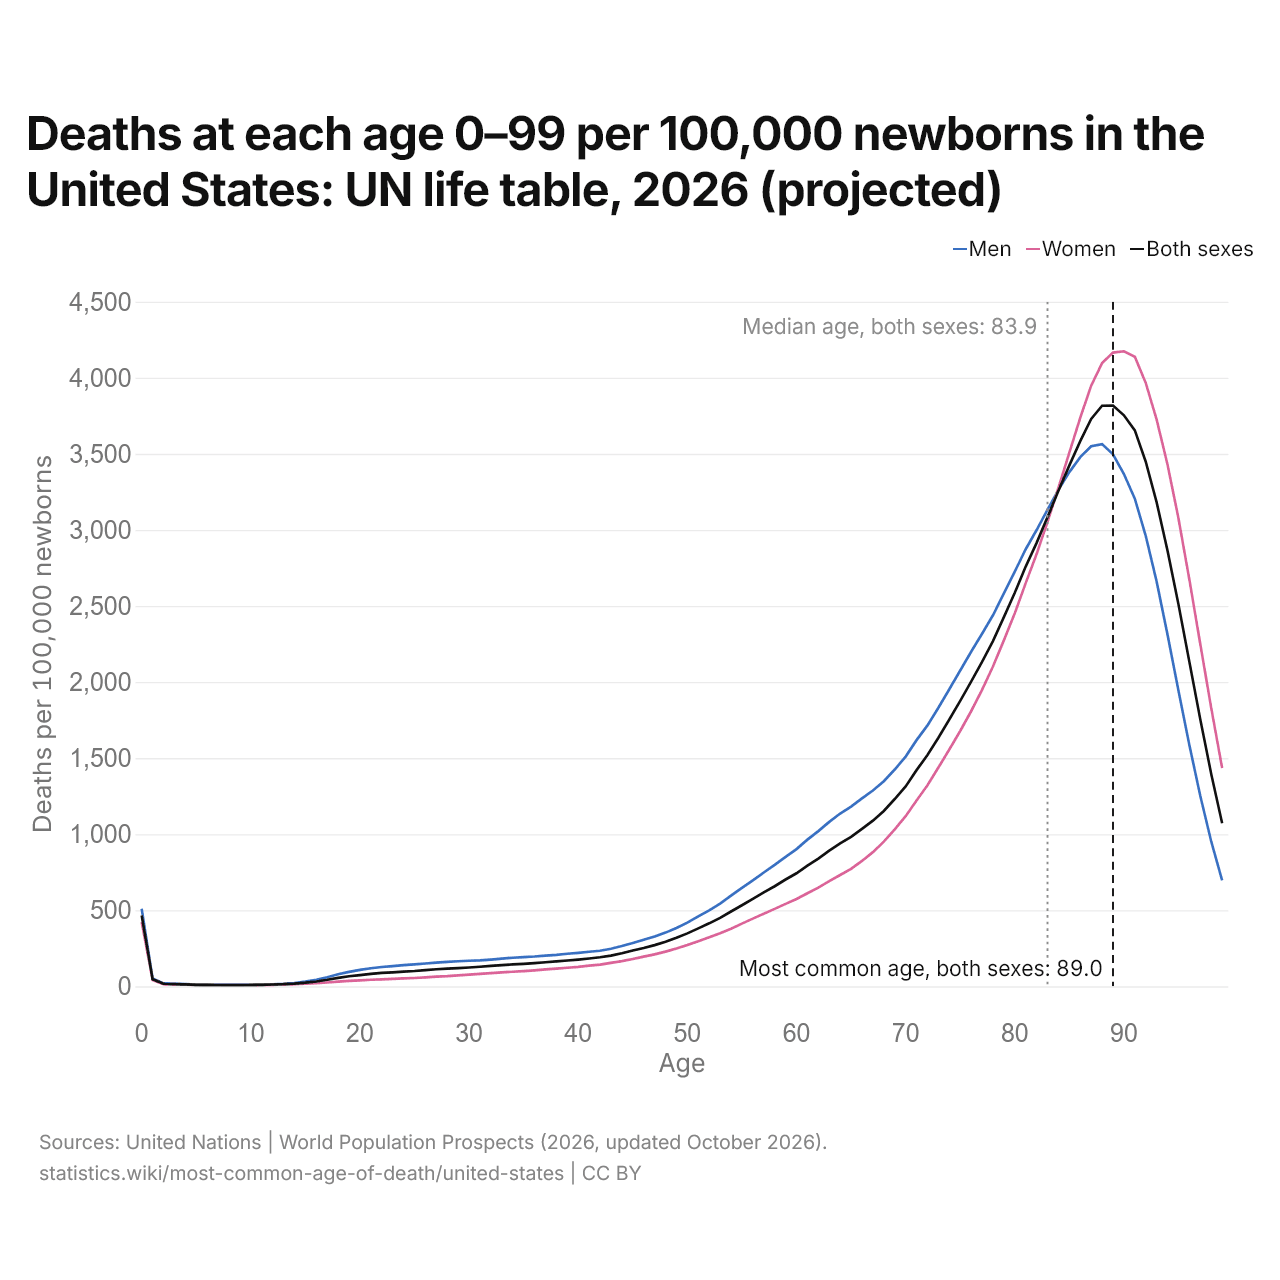
Deaths at each age 0–99 per 100,000 newborns in the United States: UN life table, 2026 (projected)
| Age | Deaths per 100,000 newborns | ||
|---|---|---|---|
| Men | Women | Both sexes | |
| 0 | 510 | 421 | 466 |
| 1 | 51 | 41 | 46 |
| 2 | 19 | 15 | 17 |
| 3 | 17 | 13 | 15 |
| 4 | 14 | 11 | 13 |
| 5 | 11 | 9 | 10 |
| 6 | 10 | 9 | 10 |
| 7 | 10 | 9 | 9 |
| 8 | 10 | 8 | 9 |
| 9 | 10 | 8 | 9 |
| 10 | 11 | 8 | 9 |
| 11 | 12 | 9 | 10 |
| 12 | 13 | 10 | 12 |
| 13 | 16 | 12 | 14 |
| 14 | 22 | 14 | 18 |
| 15 | 31 | 17 | 24 |
| 16 | 43 | 20 | 32 |
| 17 | 60 | 25 | 43 |
| 18 | 79 | 31 | 56 |
| 19 | 95 | 36 | 66 |
| 20 | 108 | 39 | 74 |
| 21 | 119 | 43 | 82 |
| 22 | 127 | 46 | 88 |
| 23 | 133 | 49 | 92 |
| 24 | 139 | 52 | 97 |
| 25 | 144 | 55 | 101 |
| 26 | 150 | 59 | 107 |
| 27 | 156 | 64 | 112 |
| 28 | 161 | 67 | 116 |
| 29 | 165 | 72 | 120 |
| 30 | 168 | 77 | 124 |
| 31 | 171 | 82 | 129 |
| 32 | 176 | 87 | 134 |
| 33 | 182 | 92 | 139 |
| 34 | 188 | 96 | 144 |
| 35 | 192 | 100 | 148 |
| 36 | 196 | 105 | 153 |
| 37 | 202 | 111 | 158 |
| 38 | 207 | 116 | 164 |
| 39 | 214 | 122 | 170 |
| 40 | 220 | 128 | 176 |
| 41 | 227 | 136 | 183 |
| 42 | 234 | 143 | 191 |
| 43 | 247 | 154 | 202 |
| 44 | 265 | 166 | 217 |
| 45 | 285 | 180 | 235 |
| 46 | 306 | 195 | 252 |
| 47 | 328 | 210 | 271 |
| 48 | 353 | 228 | 293 |
| 49 | 384 | 249 | 319 |
| 50 | 419 | 271 | 348 |
| 51 | 460 | 297 | 381 |
| 52 | 499 | 322 | 414 |
| 53 | 544 | 349 | 450 |
| 54 | 596 | 379 | 492 |
| 55 | 647 | 412 | 533 |
| 56 | 696 | 445 | 575 |
| 57 | 748 | 477 | 617 |
| 58 | 798 | 509 | 658 |
| 59 | 851 | 542 | 702 |
| 60 | 902 | 574 | 743 |
| 61 | 964 | 612 | 793 |
| 62 | 1,020 | 649 | 840 |
| 63 | 1,081 | 691 | 892 |
| 64 | 1,136 | 732 | 940 |
| 65 | 1,181 | 772 | 982 |
| 66 | 1,235 | 824 | 1,035 |
| 67 | 1,287 | 882 | 1,089 |
| 68 | 1,348 | 951 | 1,153 |
| 69 | 1,425 | 1,032 | 1,231 |
| 70 | 1,510 | 1,118 | 1,314 |
| 71 | 1,618 | 1,222 | 1,421 |
| 72 | 1,715 | 1,322 | 1,520 |
| 73 | 1,831 | 1,438 | 1,634 |
| 74 | 1,953 | 1,557 | 1,754 |
| 75 | 2,076 | 1,678 | 1,876 |
| 76 | 2,199 | 1,808 | 2,003 |
| 77 | 2,317 | 1,949 | 2,132 |
| 78 | 2,439 | 2,102 | 2,269 |
| 79 | 2,582 | 2,274 | 2,427 |
| 80 | 2,726 | 2,452 | 2,587 |
| 81 | 2,873 | 2,650 | 2,759 |
| 82 | 2,999 | 2,841 | 2,915 |
| 83 | 3,133 | 3,053 | 3,084 |
| 84 | 3,263 | 3,277 | 3,257 |
| 85 | 3,380 | 3,508 | 3,424 |
| 86 | 3,478 | 3,737 | 3,583 |
| 87 | 3,550 | 3,948 | 3,729 |
| 88 | 3,564 | 4,096 | 3,816 |
| 89 | 3,497 | 4,165 | 3,817 |
| 90 | 3,367 | 4,174 | 3,753 |
| 91 | 3,205 | 4,138 | 3,654 |
| 92 | 2,960 | 3,966 | 3,448 |
| 93 | 2,660 | 3,725 | 3,181 |
| 94 | 2,310 | 3,428 | 2,862 |
| 95 | 1,943 | 3,075 | 2,509 |
| 96 | 1,585 | 2,672 | 2,132 |
| 97 | 1,251 | 2,248 | 1,754 |
| 98 | 952 | 1,829 | 1,396 |
| 99 | 697 | 1,435 | 1,072 |
In 2026, deaths in the United States are most common at the age of 89.0, and half of all people die before 83.9. Of 100,000 newborns in the United States, 466 die before their first birthday.
Men's deaths in the United States are most common at the age of 88.2, women's at 90.2, 2.0 years later. The United States' most common age at death is the lower of the two in North America, behind Canada's 90.7.
Most common (mode above age 10) and median age at death in the United States: UN life table, 2026 (projected)
| Men | Women | Both sexes | |
|---|---|---|---|
| Most common age at death | 88.2 | 90.2 | 89.0 |
| Median age at death | 81.7 | 86.0 | 83.9 |
United States in the world ranking of the most common age at death: UN life tables, 2026 (projected)
| Rank | Country | Both sexes | Men | Women | |
|---|---|---|---|---|---|
| 22 |
 Liechtenstein |
89.2 | 87.4 | 90.4 | vs Liechtenstein |
| 23 |
 Austria |
89.1 | 87.6 | 90.3 | vs Austria |
| 24 |
 Luxembourg |
89.1 | 87.6 | 90.2 | vs Luxembourg |
| 25 |
 United States |
89.0 | 88.2 | 90.2 | |
| 26 |
 Germany |
88.9 | 87.3 | 90.0 | vs Germany |
| 27 |
 Netherlands |
88.9 | 86.9 | 90.2 | vs Netherlands |
| 28 |
 United Kingdom |
88.8 | 87.6 | 90.1 | vs UK |
Compare the most common age of death in the United States with other countries
Sources:
- United Nations | World Population Prospects (2026, updated October 2026)
Creative Commons Attribution (CC BY): you may copy, share, adapt and reuse this content, also commercially, as long as you credit statistics.wiki and note any changes you made. The sources listed above may have their own license terms.