
United Kingdom vs Bahrain life expectancy by age and sex: UN life tables, 2026 (projected)
| At age 40 |  United Kingdom |
 Bahrain |
|---|---|---|
| Average remaining years | 42.8 | 42.9 |
| Average age at death | 82.8 | 82.9 |
| Median age at death | 85.1 | 84.7 |
| Chance of reaching 65 | 91.3% | 92.3% |
| Chance of reaching 70 | 86.3% | 86.6% |
| Chance of reaching 75 | 78.8% | 77.7% |
| Chance of reaching 80 | 67.3% | 65.4% |
| Chance of reaching 85 | 50.5% | 48.9% |
| Chance of reaching 90 | 29.5% | 29.3% |
| Chance of reaching 95 | 10.9% | 12.7% |
| Chance of reaching 100 | 2.0% | 3.4% |
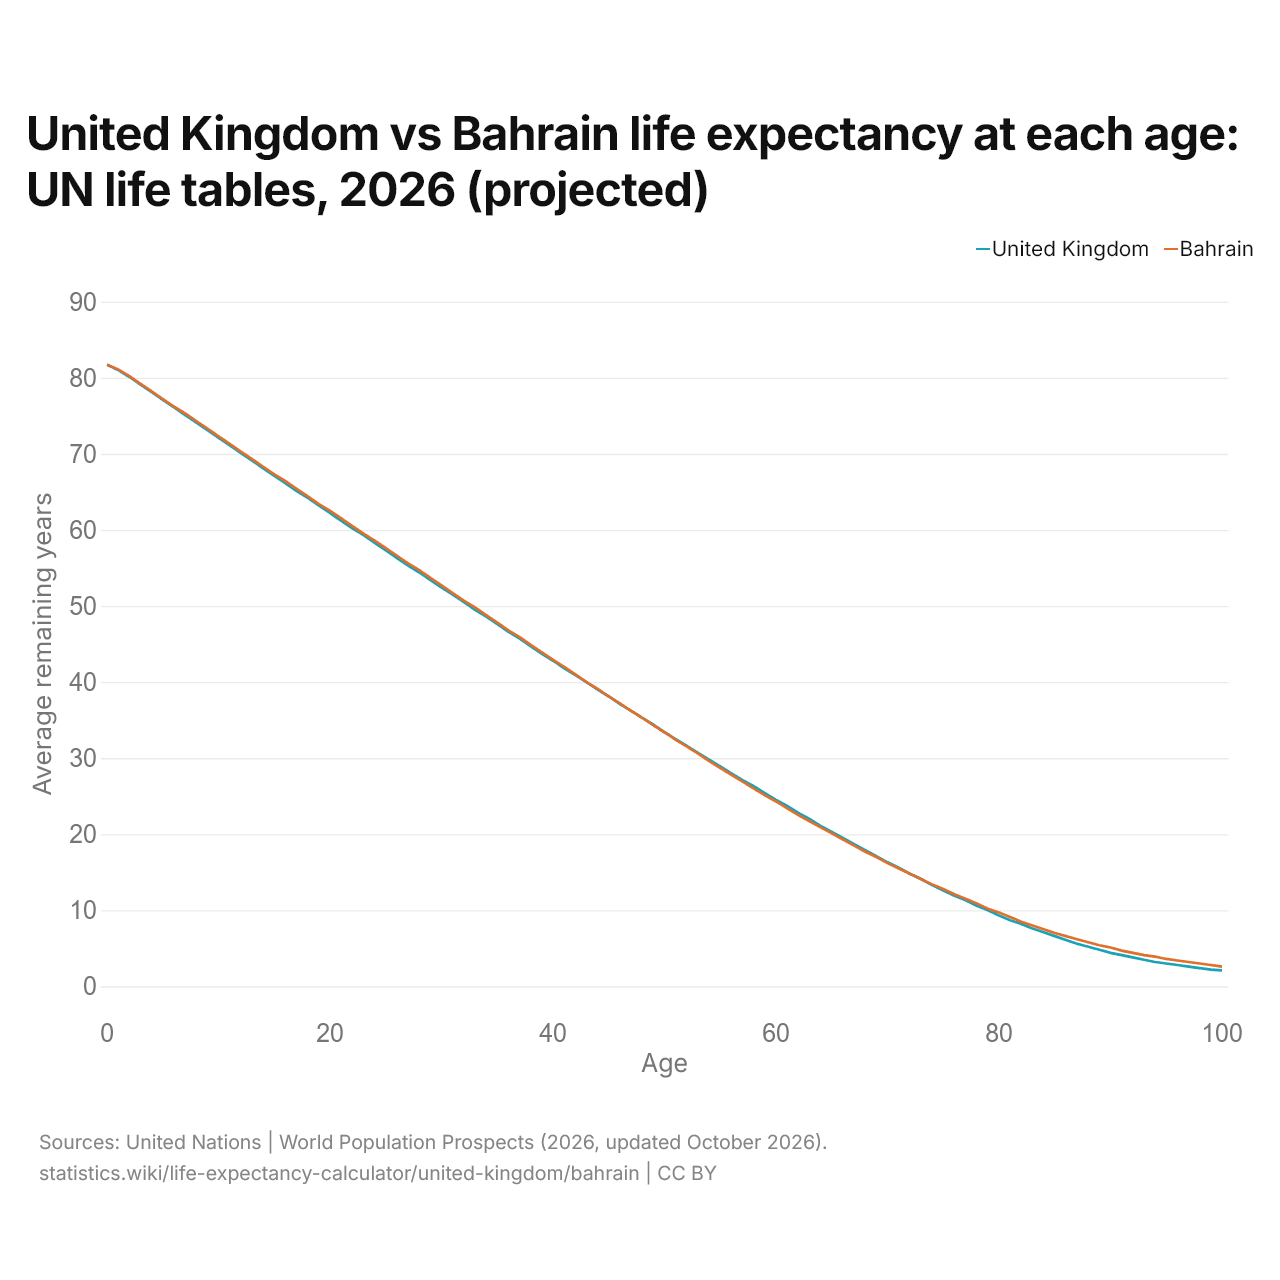
In 2026, life expectancy at birth is 81.7 years in the United Kingdom and 81.7 in Bahrain; people aged 65 live another 20.3 and 20.1 years on average.
United Kingdom vs Bahrain life expectancy at each age: UN life tables, 2026 (projected)
| Age | Average remaining years | |
|---|---|---|
| United Kingdom | Bahrain | |
| 0 | 81.7 | 81.7 |
| 1 | 81 | 81.1 |
| 2 | 80.1 | 80.2 |
| 3 | 79.1 | 79.2 |
| 4 | 78.1 | 78.2 |
| 5 | 77.1 | 77.2 |
| 6 | 76.1 | 76.2 |
| 7 | 75.1 | 75.3 |
| 8 | 74.1 | 74.3 |
| 9 | 73.1 | 73.3 |
| 10 | 72.1 | 72.3 |
| 11 | 71.1 | 71.3 |
| 12 | 70.1 | 70.3 |
| 13 | 69.1 | 69.3 |
| 14 | 68.1 | 68.3 |
| 15 | 67.1 | 67.3 |
| 16 | 66.1 | 66.4 |
| 17 | 65.1 | 65.4 |
| 18 | 64.2 | 64.4 |
| 19 | 63.2 | 63.4 |
| 20 | 62.2 | 62.5 |
| 21 | 61.2 | 61.5 |
| 22 | 60.2 | 60.5 |
| 23 | 59.3 | 59.5 |
| 24 | 58.3 | 58.6 |
| 25 | 57.3 | 57.6 |
| 26 | 56.3 | 56.6 |
| 27 | 55.3 | 55.6 |
| 28 | 54.4 | 54.7 |
| 29 | 53.4 | 53.7 |
| 30 | 52.4 | 52.7 |
| 31 | 51.5 | 51.7 |
| 32 | 50.5 | 50.7 |
| 33 | 49.5 | 49.8 |
| 34 | 48.6 | 48.8 |
| 35 | 47.6 | 47.8 |
| 36 | 46.6 | 46.8 |
| 37 | 45.7 | 45.9 |
| 38 | 44.7 | 44.9 |
| 39 | 43.7 | 43.9 |
| 40 | 42.8 | 42.9 |
| 41 | 41.8 | 42 |
| 42 | 40.9 | 41 |
| 43 | 40 | 40 |
| 44 | 39 | 39.1 |
| 45 | 38.1 | 38.1 |
| 46 | 37.1 | 37.2 |
| 47 | 36.2 | 36.2 |
| 48 | 35.3 | 35.3 |
| 49 | 34.4 | 34.3 |
| 50 | 33.4 | 33.4 |
| 51 | 32.5 | 32.4 |
| 52 | 31.6 | 31.5 |
| 53 | 30.7 | 30.6 |
| 54 | 29.8 | 29.6 |
| 55 | 28.9 | 28.7 |
| 56 | 28 | 27.8 |
| 57 | 27.1 | 26.9 |
| 58 | 26.3 | 26 |
| 59 | 25.4 | 25.1 |
| 60 | 24.5 | 24.3 |
| 61 | 23.7 | 23.4 |
| 62 | 22.8 | 22.5 |
| 63 | 22 | 21.7 |
| 64 | 21.1 | 20.9 |
| 65 | 20.3 | 20.1 |
| 66 | 19.5 | 19.3 |
| 67 | 18.7 | 18.5 |
| 68 | 17.9 | 17.7 |
| 69 | 17.1 | 17 |
| 70 | 16.3 | 16.2 |
| 71 | 15.6 | 15.5 |
| 72 | 14.8 | 14.8 |
| 73 | 14.1 | 14.1 |
| 74 | 13.3 | 13.4 |
| 75 | 12.6 | 12.8 |
| 76 | 11.9 | 12.1 |
| 77 | 11.3 | 11.5 |
| 78 | 10.6 | 10.9 |
| 79 | 10 | 10.2 |
| 80 | 9.3 | 9.7 |
| 81 | 8.7 | 9.1 |
| 82 | 8.2 | 8.5 |
| 83 | 7.6 | 8 |
| 84 | 7.1 | 7.5 |
| 85 | 6.6 | 7 |
| 86 | 6.1 | 6.6 |
| 87 | 5.6 | 6.2 |
| 88 | 5.2 | 5.8 |
| 89 | 4.8 | 5.4 |
| 90 | 4.4 | 5.1 |
| 91 | 4.1 | 4.7 |
| 92 | 3.8 | 4.4 |
| 93 | 3.5 | 4.1 |
| 94 | 3.2 | 3.9 |
| 95 | 3 | 3.6 |
| 96 | 2.8 | 3.4 |
| 97 | 2.6 | 3.2 |
| 98 | 2.4 | 3 |
| 99 | 2.2 | 2.8 |
| 100 | 2.1 | 2.6 |
People aged 80 live another 9.3 years on average in the United Kingdom and 9.7 in Bahrain: 0.4 years longer in Bahrain.
Compare life expectancy by age in any 2 countries
Sources:
- United Nations | World Population Prospects (2026, updated October 2026)
Creative Commons Attribution (CC BY): you may copy, share, adapt and reuse this content, also commercially, as long as you credit statistics.wiki and note any changes you made. The sources listed above may have their own license terms.