
Peru vs Guatemala: life expectancy at 65 (remaining years), UN life tables, 2026 (projected)
In 2026, people who reach 65 live another 19.6 years on average in Peru and 16.5 in Guatemala: 3.1 years longer in Peru.
Peru vs Guatemala: chance of a 65-year-old living to each age, UN life tables, 2026 (projected)
Men aged 65
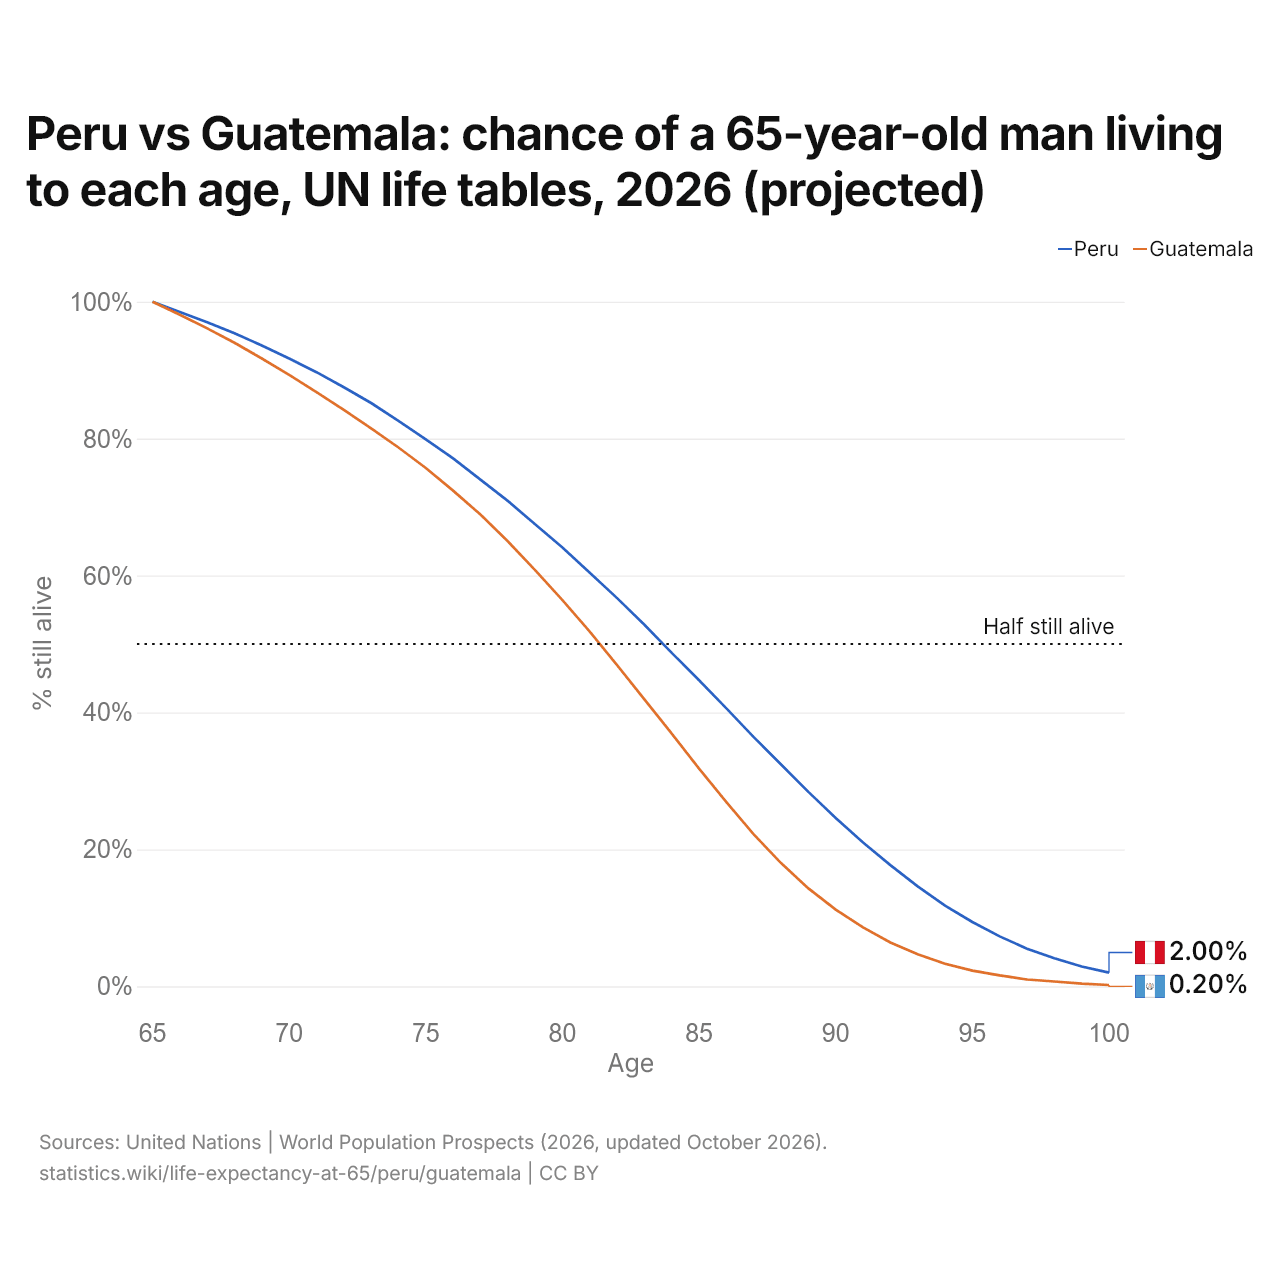
| Age | % still alive | |
|---|---|---|
| Peru | Guatemala | |
| 65 | 100% | 100% |
| 66 | 98.5% | 98.1% |
| 67 | 97% | 96.1% |
| 68 | 95.4% | 94% |
| 69 | 93.6% | 91.7% |
| 70 | 91.7% | 89.3% |
| 71 | 89.7% | 86.8% |
| 72 | 87.5% | 84.2% |
| 73 | 85.2% | 81.5% |
| 74 | 82.6% | 78.7% |
| 75 | 79.9% | 75.7% |
| 76 | 77.1% | 72.4% |
| 77 | 74% | 68.9% |
| 78 | 70.9% | 65% |
| 79 | 67.5% | 60.8% |
| 80 | 64.1% | 56.4% |
| 81 | 60.4% | 51.8% |
| 82 | 56.7% | 46.9% |
| 83 | 52.8% | 41.9% |
| 84 | 48.7% | 36.9% |
| 85 | 44.7% | 31.8% |
| 86 | 40.6% | 26.9% |
| 87 | 36.4% | 22.2% |
| 88 | 32.4% | 18% |
| 89 | 28.4% | 14.3% |
| 90 | 24.6% | 11.2% |
| 91 | 21% | 8.6% |
| 92 | 17.7% | 6.4% |
| 93 | 14.6% | 4.7% |
| 94 | 11.8% | 3.3% |
| 95 | 9.4% | 2.3% |
| 96 | 7.3% | 1.6% |
| 97 | 5.5% | 1% |
| 98 | 4.1% | 0.7% |
| 99 | 2.9% | 0.4% |
| 100 | 2% | 0.2% |
Women aged 65
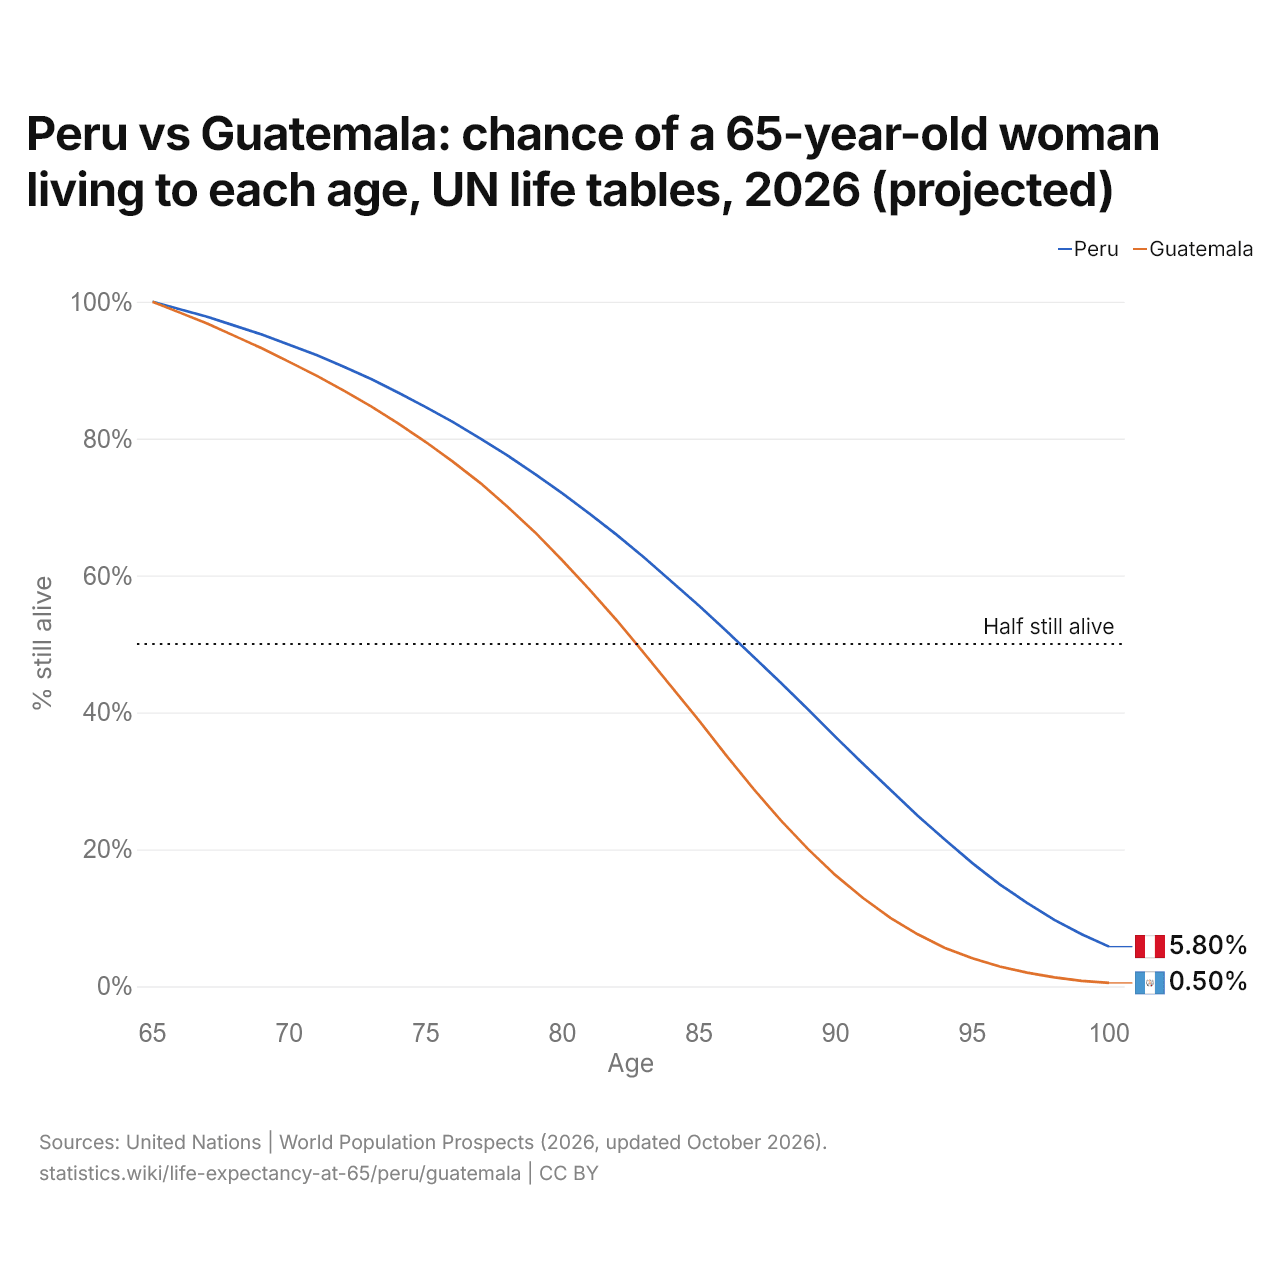
| Age | % still alive | |
|---|---|---|
| Peru | Guatemala | |
| 65 | 100% | 100% |
| 66 | 98.9% | 98.4% |
| 67 | 97.8% | 96.8% |
| 68 | 96.5% | 95% |
| 69 | 95.2% | 93.2% |
| 70 | 93.7% | 91.2% |
| 71 | 92.2% | 89.2% |
| 72 | 90.5% | 87% |
| 73 | 88.7% | 84.7% |
| 74 | 86.7% | 82.2% |
| 75 | 84.6% | 79.5% |
| 76 | 82.4% | 76.6% |
| 77 | 80% | 73.5% |
| 78 | 77.5% | 70% |
| 79 | 74.8% | 66.3% |
| 80 | 72% | 62.2% |
| 81 | 69% | 57.9% |
| 82 | 65.9% | 53.4% |
| 83 | 62.6% | 48.6% |
| 84 | 59.1% | 43.7% |
| 85 | 55.6% | 38.8% |
| 86 | 51.9% | 33.7% |
| 87 | 48.1% | 28.8% |
| 88 | 44.3% | 24.2% |
| 89 | 40.4% | 20% |
| 90 | 36.4% | 16.2% |
| 91 | 32.5% | 12.9% |
| 92 | 28.7% | 10% |
| 93 | 24.9% | 7.6% |
| 94 | 21.4% | 5.6% |
| 95 | 18% | 4.1% |
| 96 | 14.9% | 2.9% |
| 97 | 12.2% | 2% |
| 98 | 9.7% | 1.3% |
| 99 | 7.6% | 0.8% |
| 100 | 5.8% | 0.5% |
In 2026, half of the men who reach 65 live to 83 or older in Peru and to 81 or older in Guatemala; half of the women live to 86 and 82. The chance of a 65-year-old living to 100 is 2.0% for men and 5.8% for women in Peru, and 0.2% and 0.5% in Guatemala.
Peru vs Guatemala: life expectancy of men and women at 60–80, UN life tables, 2026 (projected)
| Age | Men | Women | ||
|---|---|---|---|---|
 Peru |
 Guatemala |
Peru |
Guatemala |
|
| 60 | 22.1 | 19.5 | 24.9 | 20.9 |
| 65 | 18.3 | 15.8 | 20.8 | 17.1 |
| 70 | 14.7 | 12.4 | 17.1 | 13.5 |
| 75 | 11.5 | 9.2 | 13.6 | 10.1 |
| 80 | 8.7 | 6.4 | 10.5 | 7.1 |
| Age | Men | Women | ||
|---|---|---|---|---|
| Peru |
Guatemala |
Peru |
Guatemala |
|
| 60 | 82.1 | 79.5 | 84.9 | 80.9 |
| 65 | 83.3 | 80.8 | 85.8 | 82.1 |
| 70 | 84.7 | 82.4 | 87.1 | 83.5 |
| 75 | 86.5 | 84.2 | 88.6 | 85.1 |
| 80 | 88.7 | 86.4 | 90.5 | 87.1 |
At 60, men live another 22.1 years on average in Peru and 19.5 in Guatemala, and women another 24.9 and 20.9; at 80, men another 8.7 and 6.4, and women another 10.5 and 7.1.
Peru and its neighbors: life expectancy at 65, UN life tables, 2026 (projected)





Guatemala and its neighbors: life expectancy at 65, UN life tables, 2026 (projected)




Of Peru and its five neighbors, life expectancy at 65 is highest in Chile, at 20.9 years, and lowest in Bolivia, at 15.0; of Guatemala and its four neighbors, it is highest in Mexico, at 17.9 years, and lowest in Honduras, at 15.3. Peru is second of the six, at 19.6 years, and Guatemala third of the five, at 16.5 years.
Compare life expectancy at 65 in any 2 countries
Sources:
- United Nations | World Population Prospects (2026, updated October 2026)
Creative Commons Attribution (CC BY): you may copy, share, adapt and reuse this content, also commercially, as long as you credit statistics.wiki and note any changes you made. The sources listed above may have their own license terms.