
台湾とオランダの発電量に占める原子力発電の割合の推移(1985~2025年)
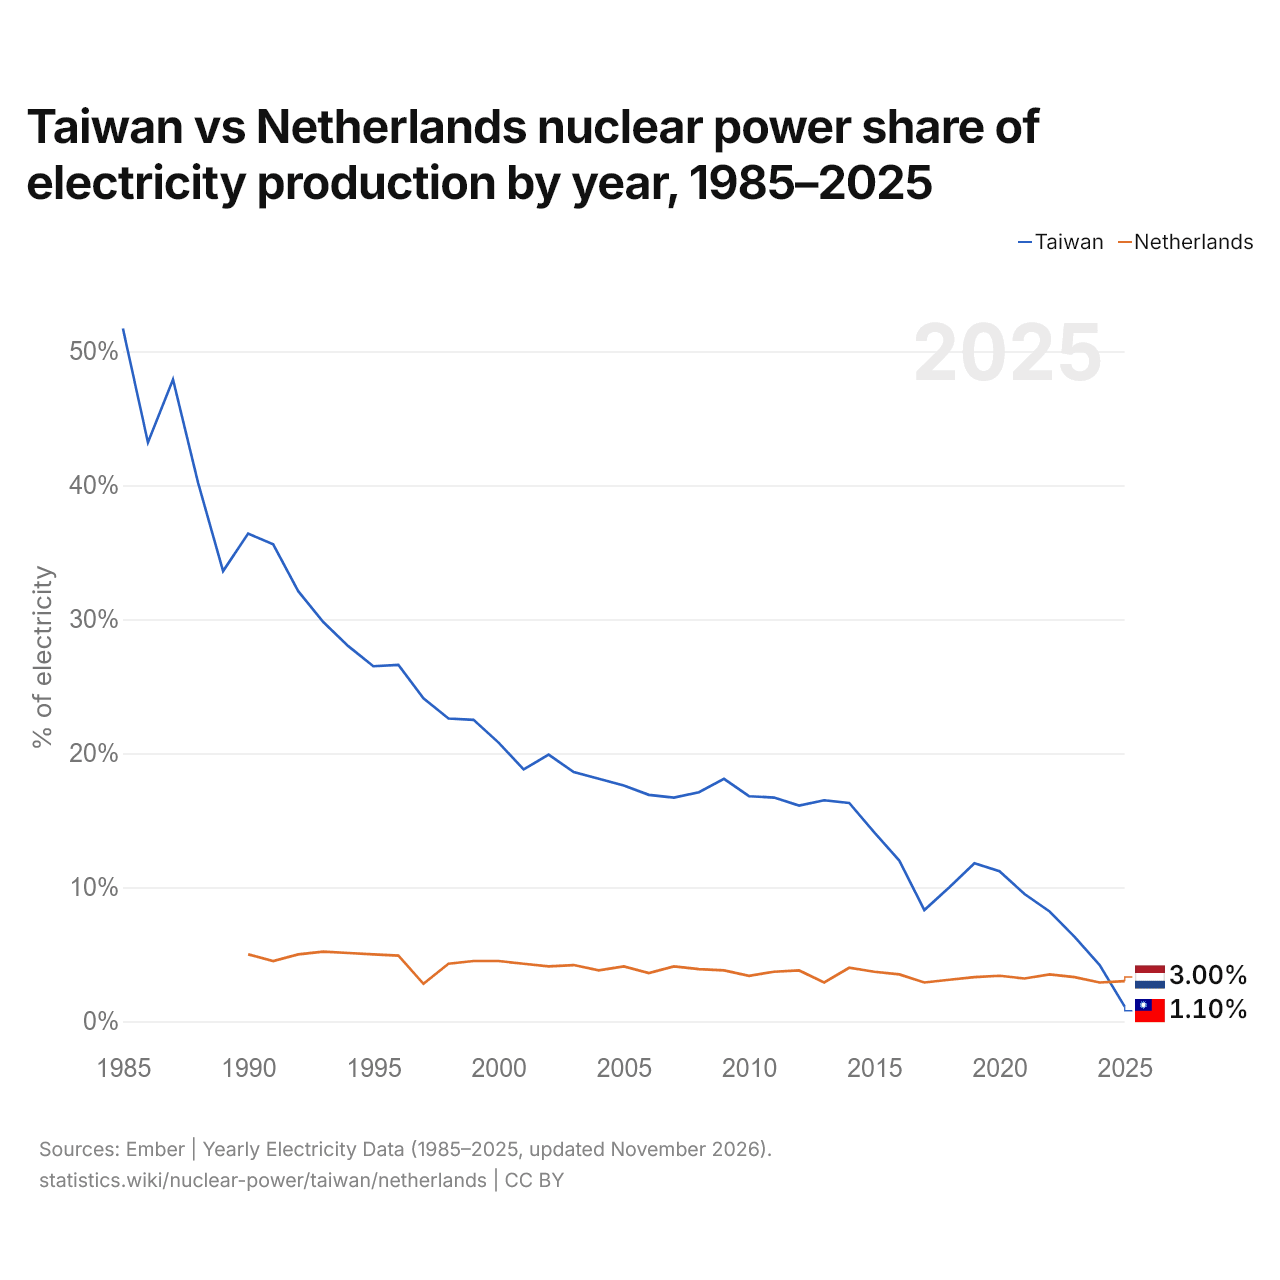
2025年の発電量に占める原子力発電の割合は台湾が1.1%、オランダが3.0%で、オランダのほうが1.9ポイント高かった。1990年は台湾が36.4%、オランダが5.0%で、台湾のほうが31.4ポイント高かった。
台湾とオランダの原子力の発電量に占める割合と発電量(TWh)(2025年)


任意の2か国の原子力発電を比較
出典:
- Ember | Yearly Electricity Data(1985~2025年、2026年11月更新)
クリエイティブ・コモンズ 表示(CC BY):statistics.wikiを出典として明記し、変更した場合はその旨を示せば、このコンテンツを商用目的も含めて複製、共有、改変、再利用できます。上記の出典には、それぞれ独自のライセンス条件が適用される場合があります。