
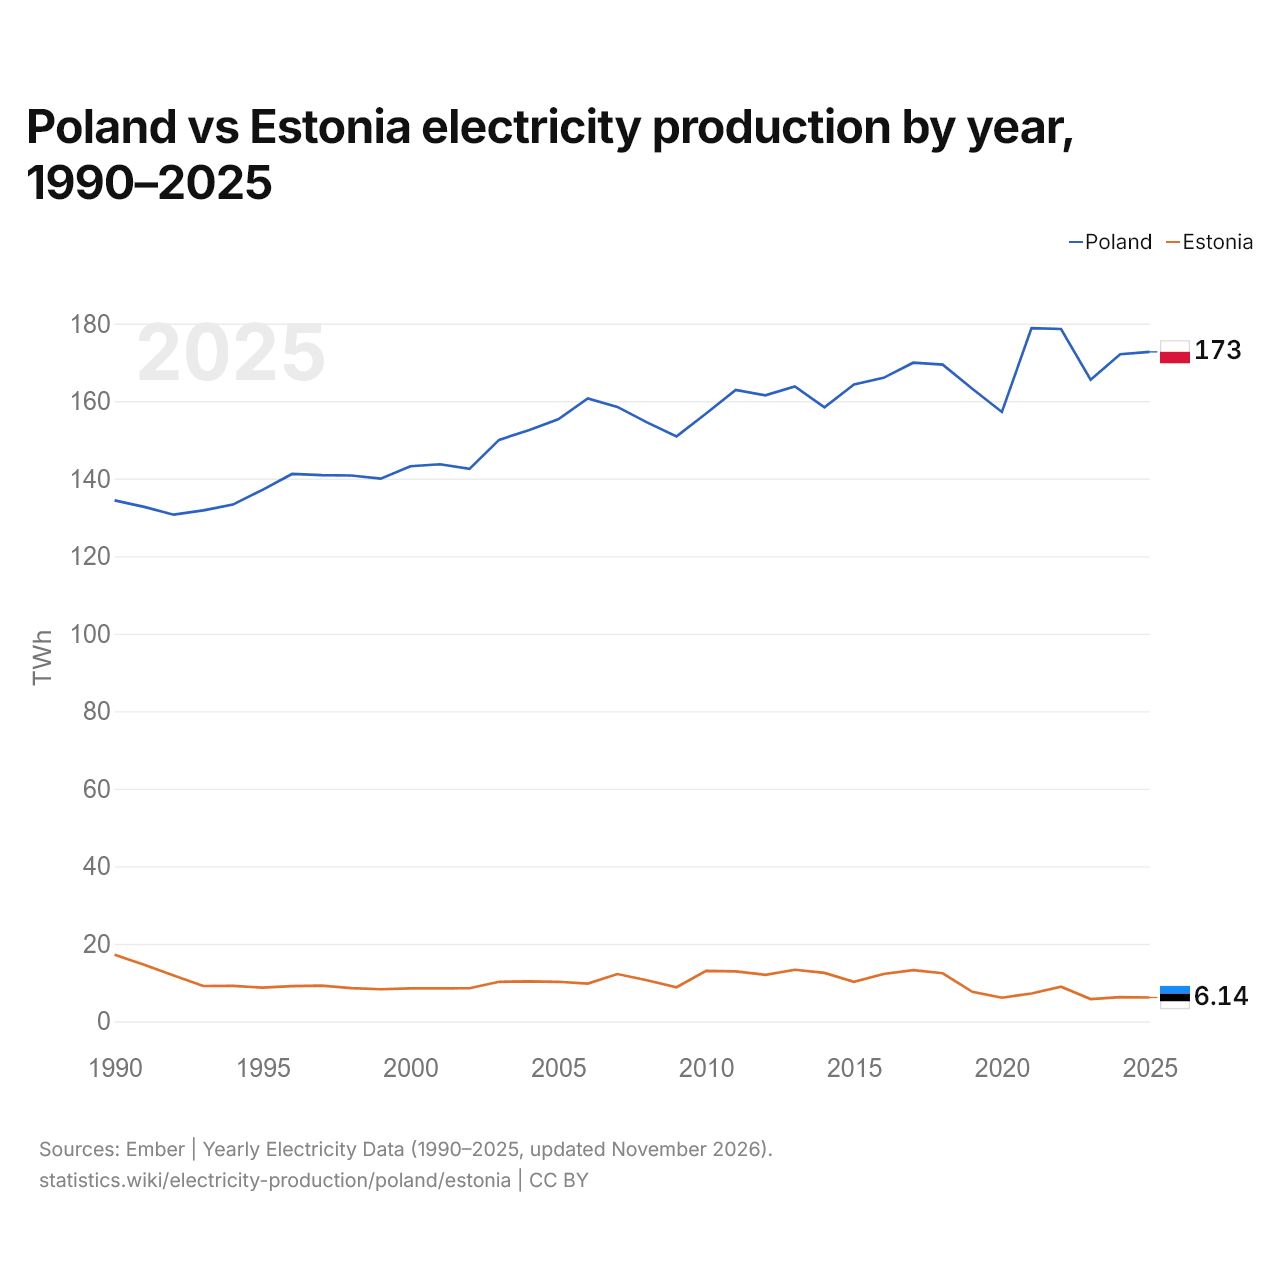
ポーランドとエストニアの発電量の推移(1990~2025年)
1x
| 年 | TWh | |
|---|---|---|
| ポーランド | エストニア | |
| 2025 | 172.7 | 6.14 |
| 2024 | 172.1 | 6.25 |
| 2023 | 165.5 | 5.74 |
| 2022 | 178.6 | 8.94 |
| 2021 | 178.8 | 7.19 |
| 2020 | 157.2 | 6.08 |
| 2019 | 163.2 | 7.61 |
| 2018 | 169.4 | 12.4 |
| 2017 | 169.9 | 13.2 |
| 2016 | 166 | 12.2 |
| 2015 | 164.3 | 10.2 |
| 2014 | 158.4 | 12.5 |
| 2013 | 163.8 | 13.3 |
| 2012 | 161.5 | 12 |
| 2011 | 162.9 | 12.9 |
| 2010 | 156.8 | 13 |
| 2009 | 150.9 | 8.78 |
| 2008 | 154.5 | 10.6 |
| 2007 | 158.5 | 12.2 |
| 2006 | 160.7 | 9.73 |
| 2005 | 155.3 | 10.2 |
| 2004 | 152.5 | 10.3 |
| 2003 | 150 | 10.2 |
| 2002 | 142.5 | 8.53 |
| 2001 | 143.7 | 8.49 |
| 2000 | 143.2 | 8.51 |
| 1999 | 140 | 8.27 |
| 1998 | 140.8 | 8.55 |
| 1997 | 140.9 | 9.22 |
| 1996 | 141.2 | 9.09 |
| 1995 | 137.1 | 8.69 |
| 1994 | 133.3 | 9.15 |
| 1993 | 131.8 | 9.12 |
| 1992 | 130.7 | 11.8 |
| 1991 | 132.7 | 14.6 |
| 1990 | 134.4 | 17.2 |
2025年の発電量はポーランドが173TWh、エストニアが6.14TWhで、ポーランドのほうが28倍多かった。1990年はポーランドが134TWh、エストニアが17.2TWhで、ポーランドのほうが7.8倍多かった。
1990年以降、ポーランドの発電量は毎年エストニアを上回っている。
ポーランドとエストニアの電源別発電量(2025年)


任意の2か国の発電量を比較
出典:
- Ember | Yearly Electricity Data(1990~2025年、2026年11月更新)
- 世界銀行 | Health(2025年、2026年10月更新)
クリエイティブ・コモンズ 表示(CC BY):statistics.wikiを出典として明記し、変更した場合はその旨を示せば、このコンテンツを商用目的も含めて複製、共有、改変、再利用できます。上記の出典には、それぞれ独自のライセンス条件が適用される場合があります。