
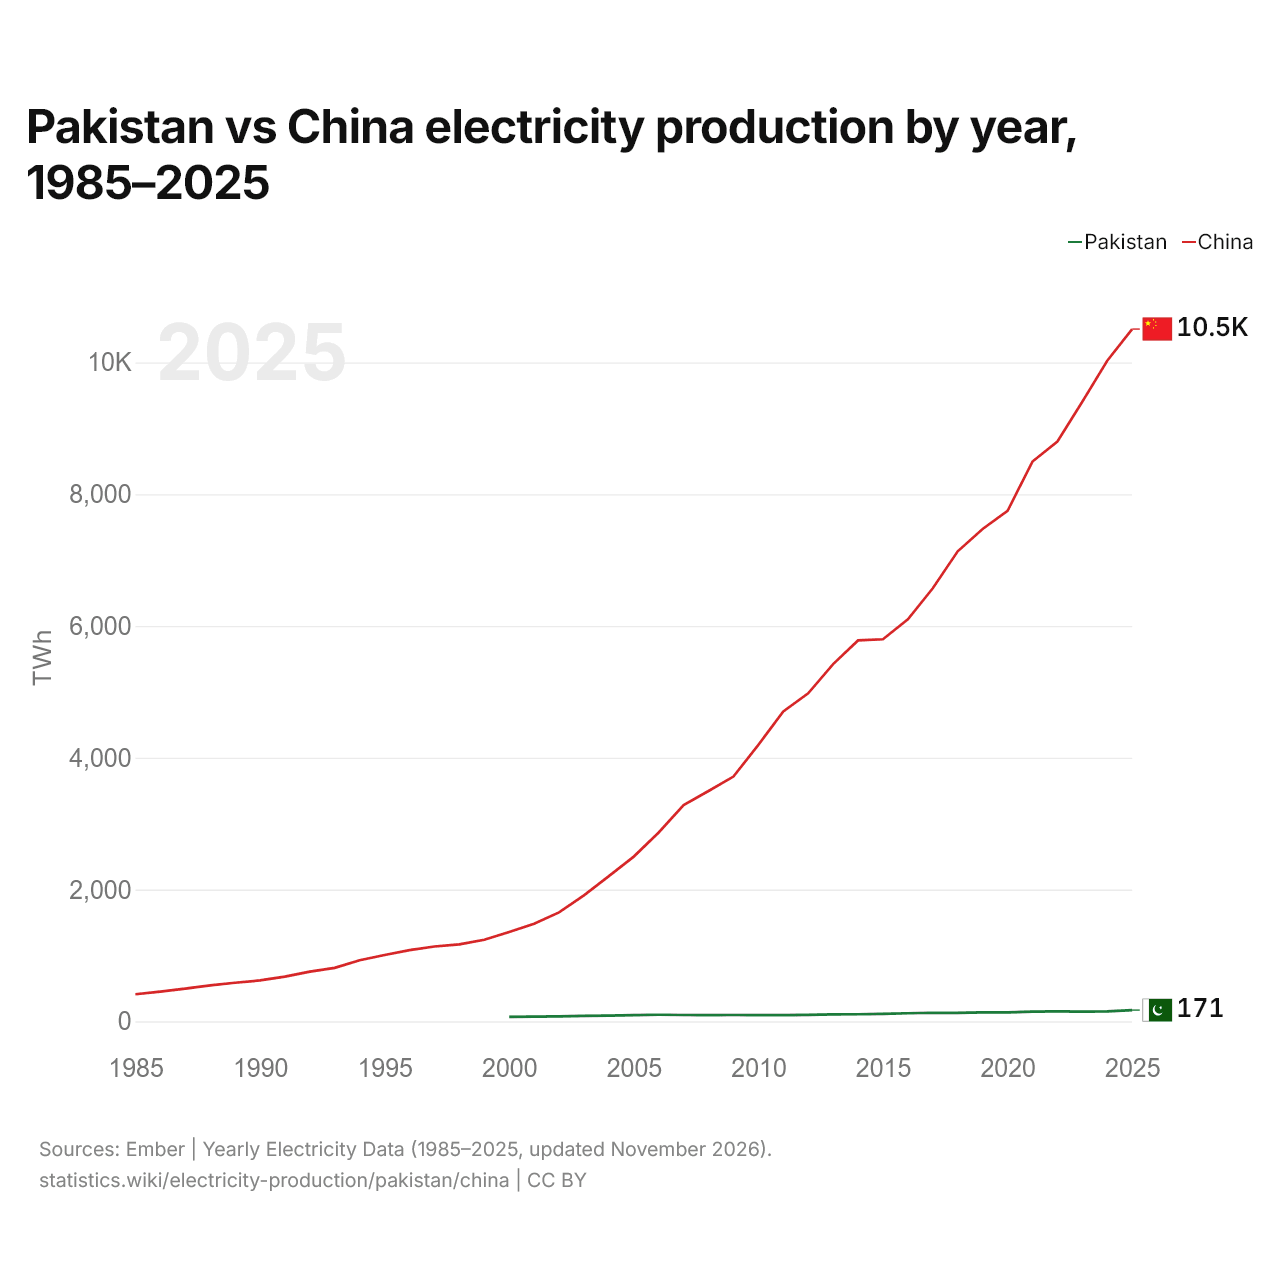
パキスタンと中国の発電量の推移(1985~2025年)
1x
| 年 | TWh | |
|---|---|---|
| パキスタン | 中国 | |
| 2025 | 170.7 | 10,506 |
| 2024 | 151.4 | 10,025 |
| 2023 | 148.1 | 9,403 |
| 2022 | 152 | 8,800 |
| 2021 | 148.2 | 8,496 |
| 2020 | 135.5 | 7,746 |
| 2019 | 134.9 | 7,472 |
| 2018 | 129 | 7,133 |
| 2017 | 130.4 | 6,572 |
| 2016 | 122.9 | 6,102 |
| 2015 | 112.8 | 5,799 |
| 2014 | 107.9 | 5,781 |
| 2013 | 104.9 | 5,421 |
| 2012 | 98.1 | 4,978 |
| 2011 | 94.8 | 4,702 |
| 2010 | 94.5 | 4,196 |
| 2009 | 96.1 | 3,715 |
| 2008 | 93 | 3,496 |
| 2007 | 96.2 | 3,282 |
| 2006 | 99.5 | 2,866 |
| 2005 | 94.6 | 2,500 |
| 2004 | 86 | 2,203 |
| 2003 | 82.1 | 1,911 |
| 2002 | 75.8 | 1,654 |
| 2001 | 72.1 | 1,481 |
| 2000 | 66.5 | 1,356 |
| 1999 | - | 1,239 |
| 1998 | - | 1,167 |
| 1997 | - | 1,136 |
| 1996 | - | 1,081 |
| 1995 | - | 1,007 |
| 1994 | - | 928 |
| 1993 | - | 812 |
| 1992 | - | 754 |
| 1991 | - | 678 |
| 1990 | - | 621 |
| 1989 | - | 585 |
| 1988 | - | 545 |
| 1987 | - | 497 |
| 1986 | - | 450 |
| 1985 | - | 411 |
2025年の発電量はパキスタンが171TWh、中国が10,506TWhで、中国のほうが62倍多かった。2000年はパキスタンが66.5TWh、中国が1,356TWhで、中国のほうが20倍多かった。
2000年以降、中国の発電量は毎年パキスタンを上回っている。
パキスタンと中国の電源別発電量(2025年)


任意の2か国の発電量を比較
出典:
- Ember | Yearly Electricity Data(1985~2025年、2026年11月更新)
- 世界銀行 | Health(2025年、2026年10月更新)
クリエイティブ・コモンズ 表示(CC BY):statistics.wikiを出典として明記し、変更した場合はその旨を示せば、このコンテンツを商用目的も含めて複製、共有、改変、再利用できます。上記の出典には、それぞれ独自のライセンス条件が適用される場合があります。