
Immigrants (foreign-born) in Belgium
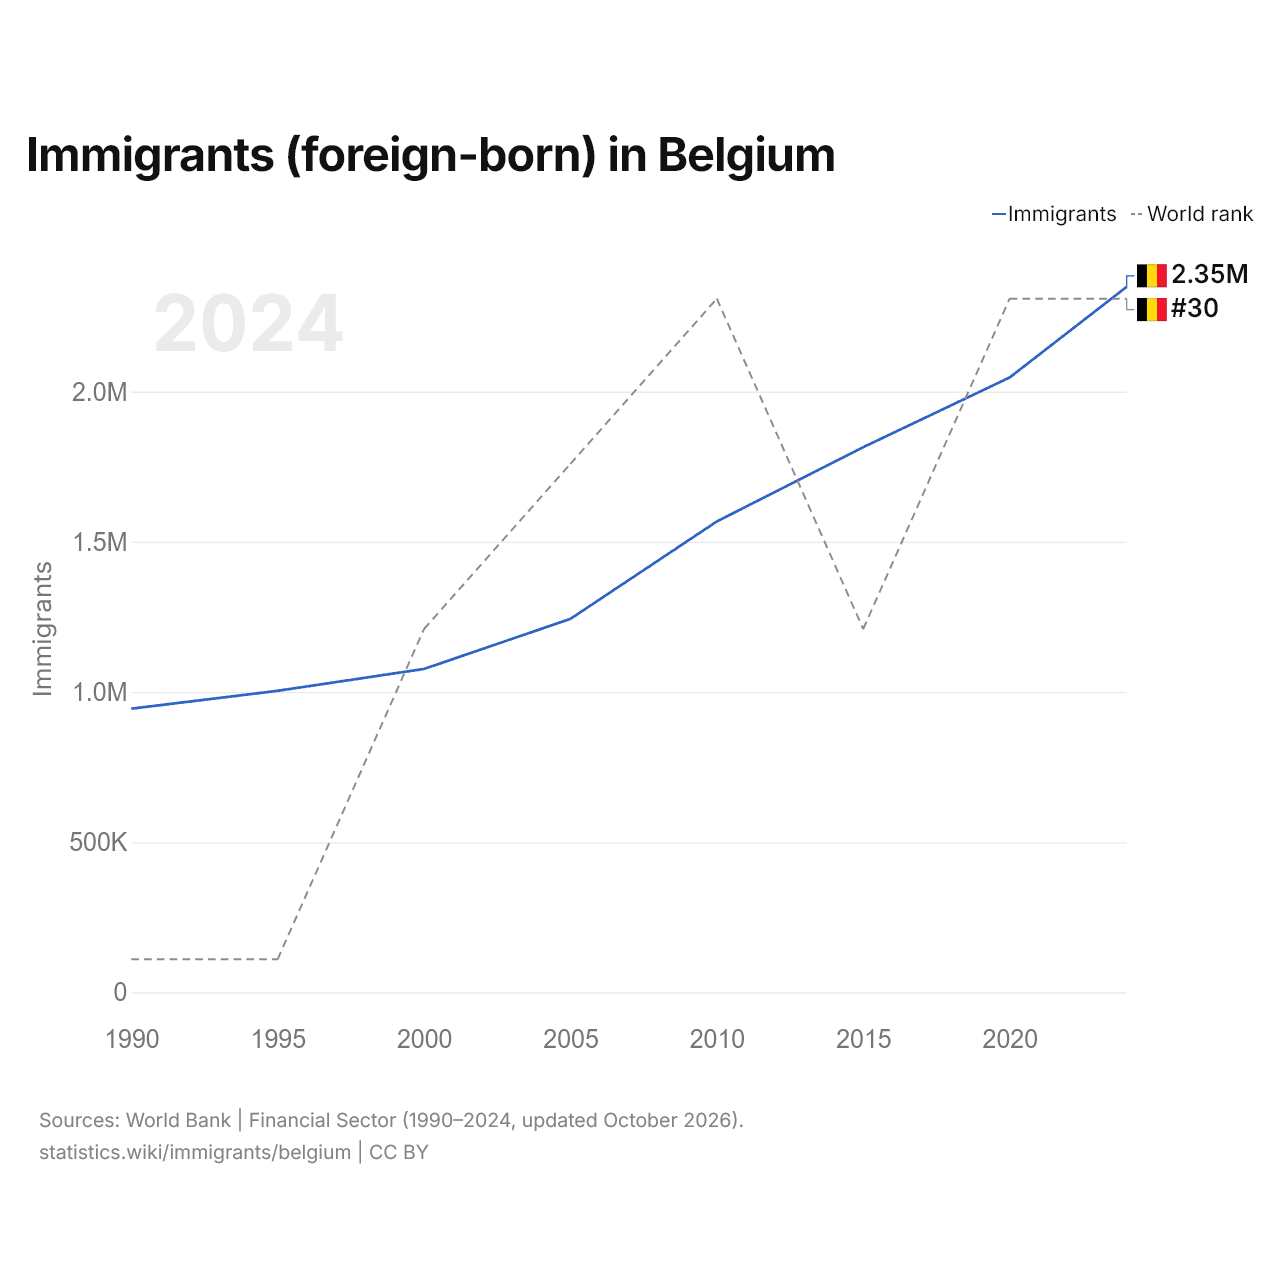
| Year | Immigrants | World rank |
|---|---|---|
| Immigrants | World rank | |
| 2024 | 2,349,032 | #30 |
| 2020 | 2,046,975 | #30 |
| 2015 | 1,814,949 | #32 |
| 2010 | 1,567,639 | #30 |
| 2005 | 1,243,352 | #31 |
| 2000 | 1,076,676 | #32 |
| 1995 | 1,003,834 | #34 |
| 1990 | 944,340 | #34 |
The number of immigrants living in Belgium is 2.35 million, compared with 944,340 in 1990. By the number of immigrants, Belgium ranks 30th in the world.
Belgium's 2.35 million immigrants are 0.77% of the world's 303 million. The number of immigrants in Belgium rose most from 2005 to 2010, by 324,287.
Belgium immigrants: number, share of population and change since 2000
| Immigrants | 2,349,032 |
|---|---|
| Share of population | 20.0% |
| Change, 2000–2024 | +1,272,356 |
| World rank by number | 30/195 |
| World rank by share | 30/195 |
Immigrants as a share of the population of Belgium
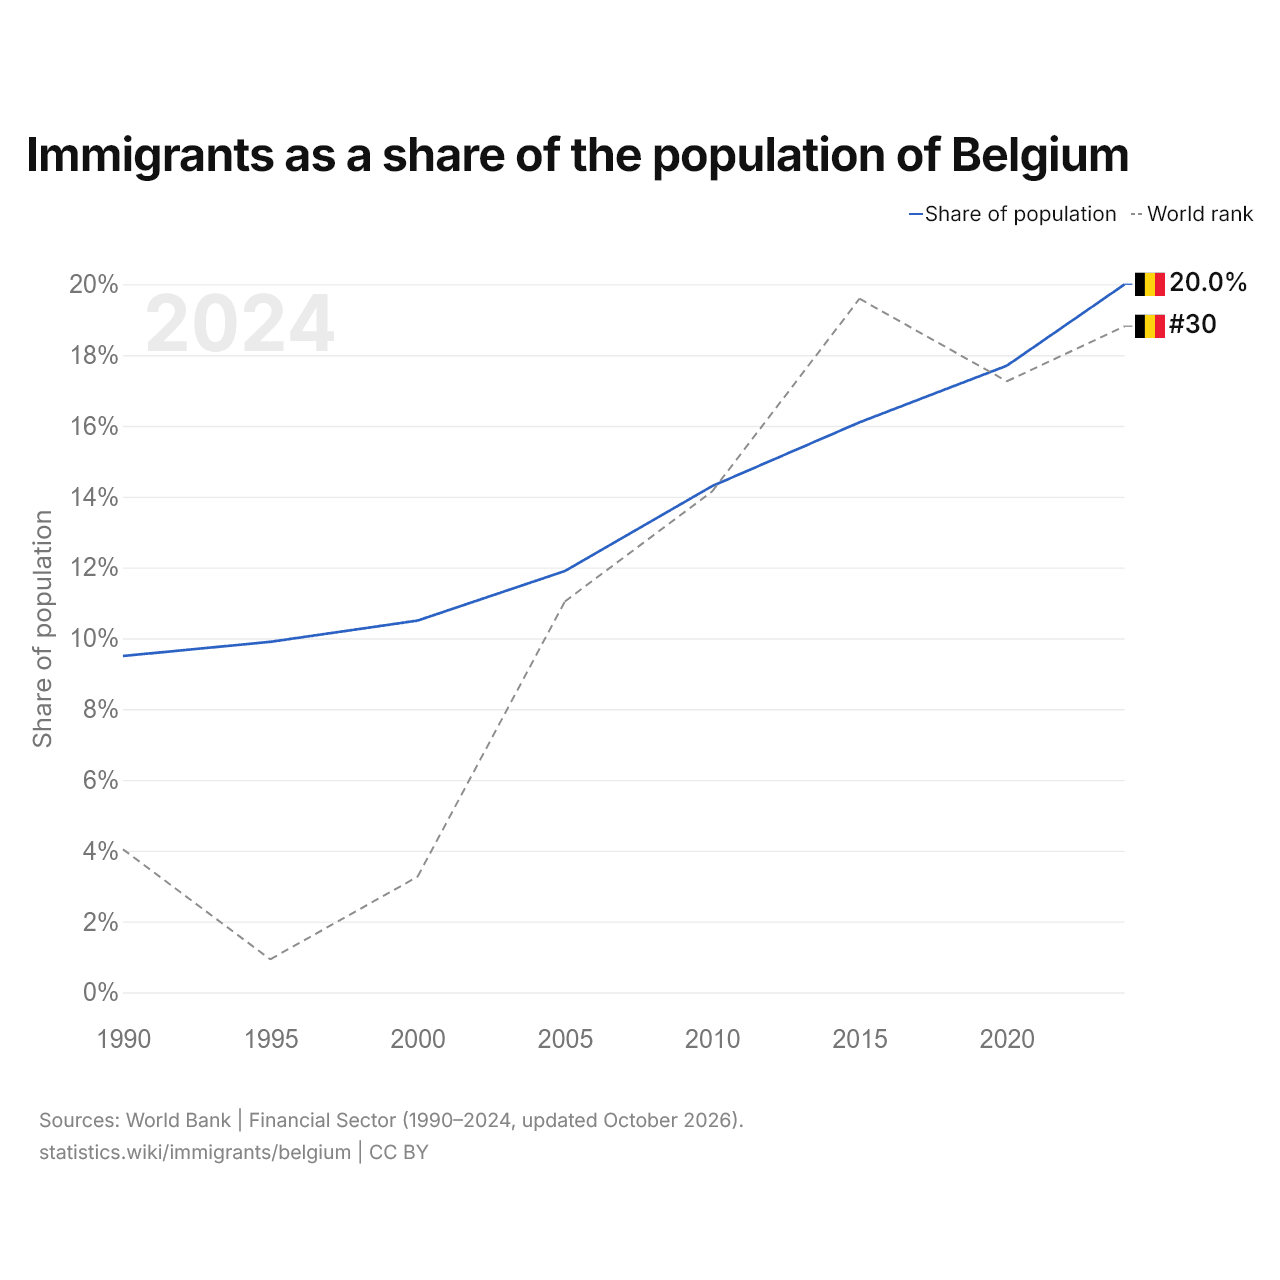
Immigrants make up 20% of Belgium's population, compared with 9.5% in 1990. By this share, Belgium ranks 30th in the world. Belgium's highest rank by this share was 29th, last held in 2015.
Belgium's share of immigrants is the 11th highest of 44 countries in Europe, where it ranges from Bosnia and Herzegovina's 1.1% to Monaco's 70.2%.
Belgium in the world ranking by number of immigrants
| Rank | Country | Immigrants | Share of population | |
|---|---|---|---|---|
| 27 |
 Switzerland |
2,773,840 | 31.1% | vs Switzerland |
| 28 |
 South Africa |
2,631,100 | 4.1% | |
| 29 |
 Sudan |
2,397,113 | 4.8% | |
| 30 |
 Belgium |
2,349,032 | 20.0% | |
| 31 |
 Qatar |
2,337,000 | 76.7% | |
| 32 |
 Austria |
2,327,064 | 25.5% | vs Austria |
| 33 |
 Oman |
2,283,366 | 43.2% |
Compare Belgium immigrant population with other countries
Sources:
- World Bank | Financial Sector (1990–2024, updated October 2026)
Creative Commons Attribution (CC BY): you may copy, share, adapt and reuse this content, also commercially, as long as you credit statistics.wiki and note any changes you made. The sources listed above may have their own license terms.