
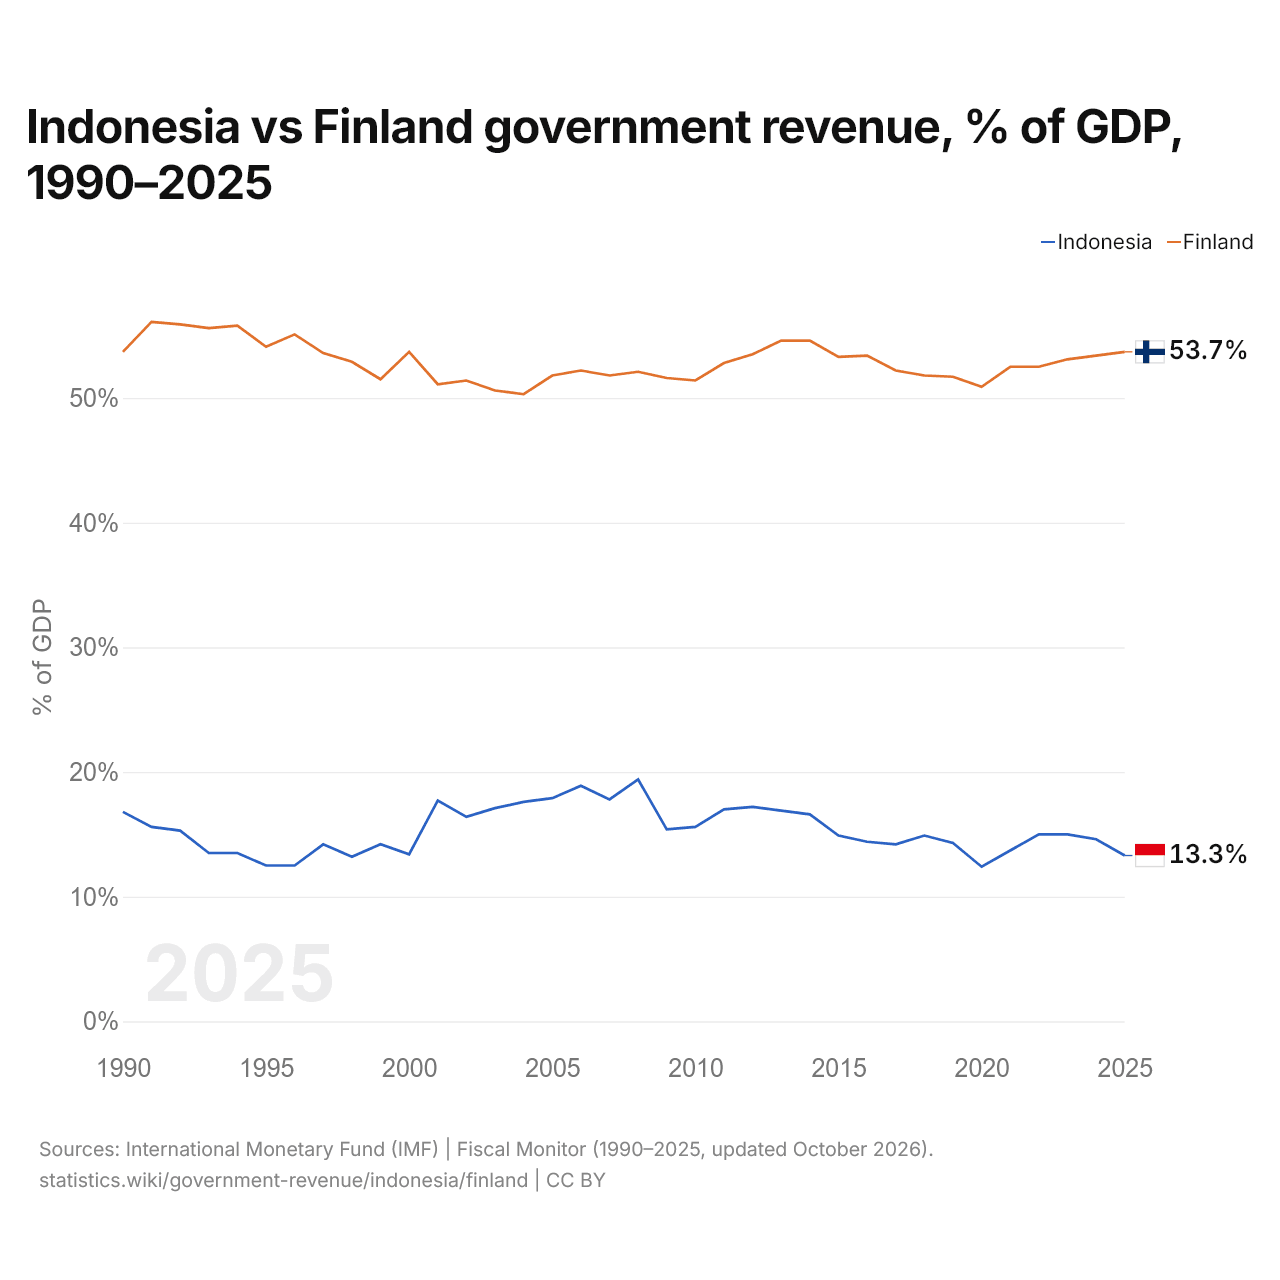
Indonesia vs Finland government revenue, % of GDP, 1990–2025
| Year | % of GDP | |
|---|---|---|
 Indonesia |
 Finland |
|
| 2025 | 13.3% | 53.7% |
| 2024 | 14.6% | 53.4% |
| 2023 | 15% | 53.1% |
| 2022 | 15% | 52.5% |
| 2021 | 13.7% | 52.5% |
| 2020 | 12.4% | 50.9% |
| 2019 | 14.3% | 51.7% |
| 2018 | 14.9% | 51.8% |
| 2017 | 14.2% | 52.2% |
| 2016 | 14.4% | 53.4% |
| 2015 | 14.9% | 53.3% |
| 2014 | 16.6% | 54.6% |
| 2013 | 16.9% | 54.6% |
| 2012 | 17.2% | 53.5% |
| 2011 | 17% | 52.8% |
| 2010 | 15.6% | 51.4% |
| 2009 | 15.4% | 51.6% |
| 2008 | 19.4% | 52.1% |
| 2007 | 17.8% | 51.8% |
| 2006 | 18.9% | 52.2% |
| 2005 | 17.9% | 51.8% |
| 2004 | 17.6% | 50.3% |
| 2003 | 17.1% | 50.6% |
| 2002 | 16.4% | 51.4% |
| 2001 | 17.7% | 51.1% |
| 2000 | 13.4% | 53.7% |
| 1999 | 14.2% | 51.5% |
| 1998 | 13.2% | 52.9% |
| 1997 | 14.2% | 53.6% |
| 1996 | 12.5% | 55.1% |
| 1995 | 12.5% | 54.1% |
| 1994 | 13.5% | 55.8% |
| 1993 | 13.5% | 55.6% |
| 1992 | 15.3% | 55.9% |
| 1991 | 15.6% | 56.1% |
| 1990 | 16.8% | 53.7% |
In 2025, government revenue was 13.3% of GDP in Indonesia and 53.7% in Finland: 40.4 percentage points higher in Finland. In 2015, it was 14.9% in Indonesia and 53.3% in Finland, 38.4 percentage points higher in Finland.
Finland's government revenue, as a share of GDP, has been higher than Indonesia's every year since 1990. The gap was widest in 1996, when Finland's government revenue was 42.6 percentage points of GDP above Indonesia's.
Indonesia vs Finland: government revenue figures
Compare the government revenue of any 2 countries
Sources:
- International Monetary Fund (IMF) | Fiscal Monitor (1990–2025, updated October 2026)
- World Bank | Economy & Growth (2025, updated October 2026)
Creative Commons Attribution (CC BY): you may copy, share, adapt and reuse this content, also commercially, as long as you credit statistics.wiki and note any changes you made. The sources listed above may have their own license terms.