
Guinea government debt (% of GDP), 1990–2025
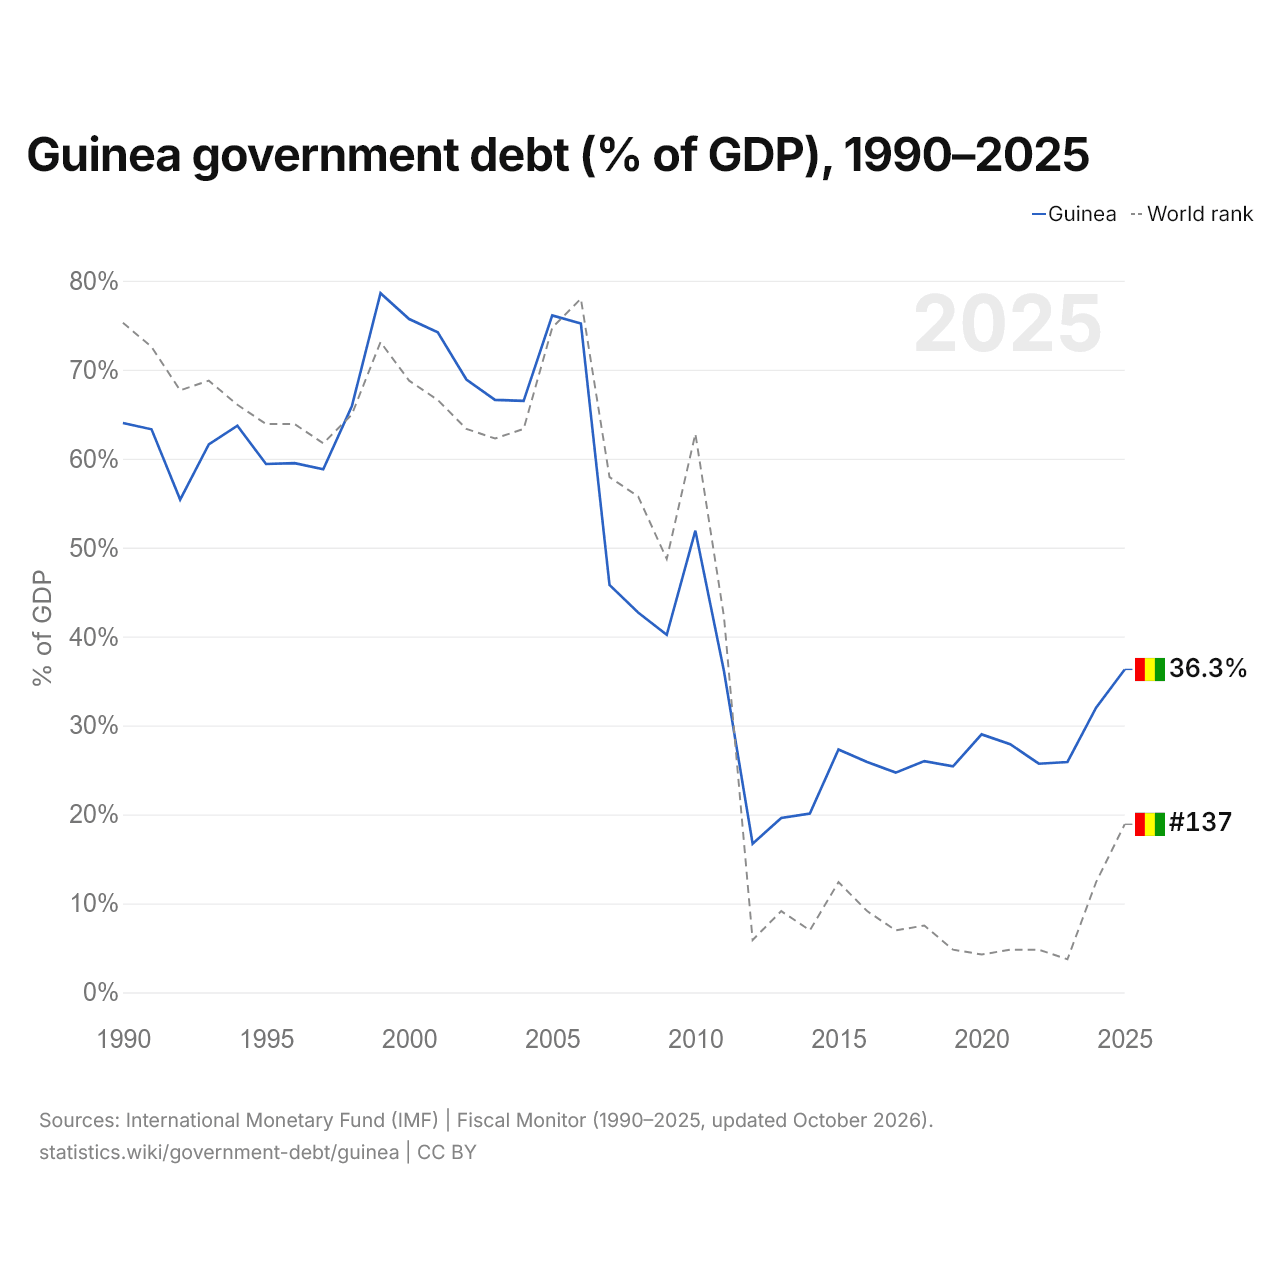
In 2025, Guinea's government debt was 36.3% of GDP, down from 64.0% in 1990. It was highest in 1999, at 78.6%. It was the 137th highest share in the world, up from 149th in 2024. Its highest rank was 28th, last held in 2006.
In 2025, Guinea's government debt was the 45th highest of 52 countries in Africa, where it ranged from the DR Congo's 20.4% to Eritrea's 260.4% (2019). The largest ten-year fall in Guinea's government debt was from 2000 to 2010, by 23.8 percentage points of GDP; the largest ten-year rise was from 1990 to 2000, by 11.7 points. In 2025, Guinea's government had a budget deficit of 6.4% of GDP.
Guinea government debt in US$ and % of GDP
| Year | US$ | % of GDP | US$ per person | World rank |
|---|---|---|---|---|
| 2025 | $10.3B | 36.3% | $681 | #137 |
| 2020 | $4.09B | 29.0% | $306 | #164 |
| 2010 | $3.56B | 51.9% | $342 | #56 |
| 2000 | $3.30B | 75.7% | $392 | #45 |
| 1990 | $2.49B | 64.0% | $386 | #33 |
Guinea government debt in US$, 1990–2025
| Year | Current US$ |
|---|---|
| Guinea | |
| 2025 | $10,289,797,815 |
| 2024 | $8,012,488,217 |
| 2023 | $5,809,333,715 |
| 2022 | $5,123,268,445 |
| 2021 | $4,757,129,330 |
| 2020 | $4,088,271,890 |
| 2019 | $3,411,030,267 |
| 2018 | $3,084,856,451 |
| 2017 | $2,545,623,990 |
| 2016 | $2,226,147,767 |
| 2015 | $2,399,472,467 |
| 2014 | $1,766,706,918 |
| 2013 | $1,639,720,522 |
| 2012 | $1,271,839,454 |
| 2011 | $2,449,233,716 |
| 2010 | $3,559,425,824 |
| 2009 | $2,697,745,757 |
| 2008 | $2,974,610,268 |
| 2007 | $2,878,196,854 |
| 2006 | $3,171,873,666 |
| 2005 | $3,260,602,307 |
| 2004 | $3,527,488,969 |
| 2003 | $3,347,448,449 |
| 2002 | $2,962,984,599 |
| 2001 | $3,061,994,947 |
| 2000 | $3,304,091,219 |
| 1999 | $3,965,144,401 |
| 1998 | $3,446,758,906 |
| 1997 | $3,246,572,708 |
| 1996 | $3,357,492,807 |
| 1995 | $3,200,520,805 |
| 1994 | $3,140,493,373 |
| 1993 | $2,942,828,771 |
| 1992 | $2,652,162,499 |
| 1991 | $2,782,227,410 |
| 1990 | $2,486,791,493 |
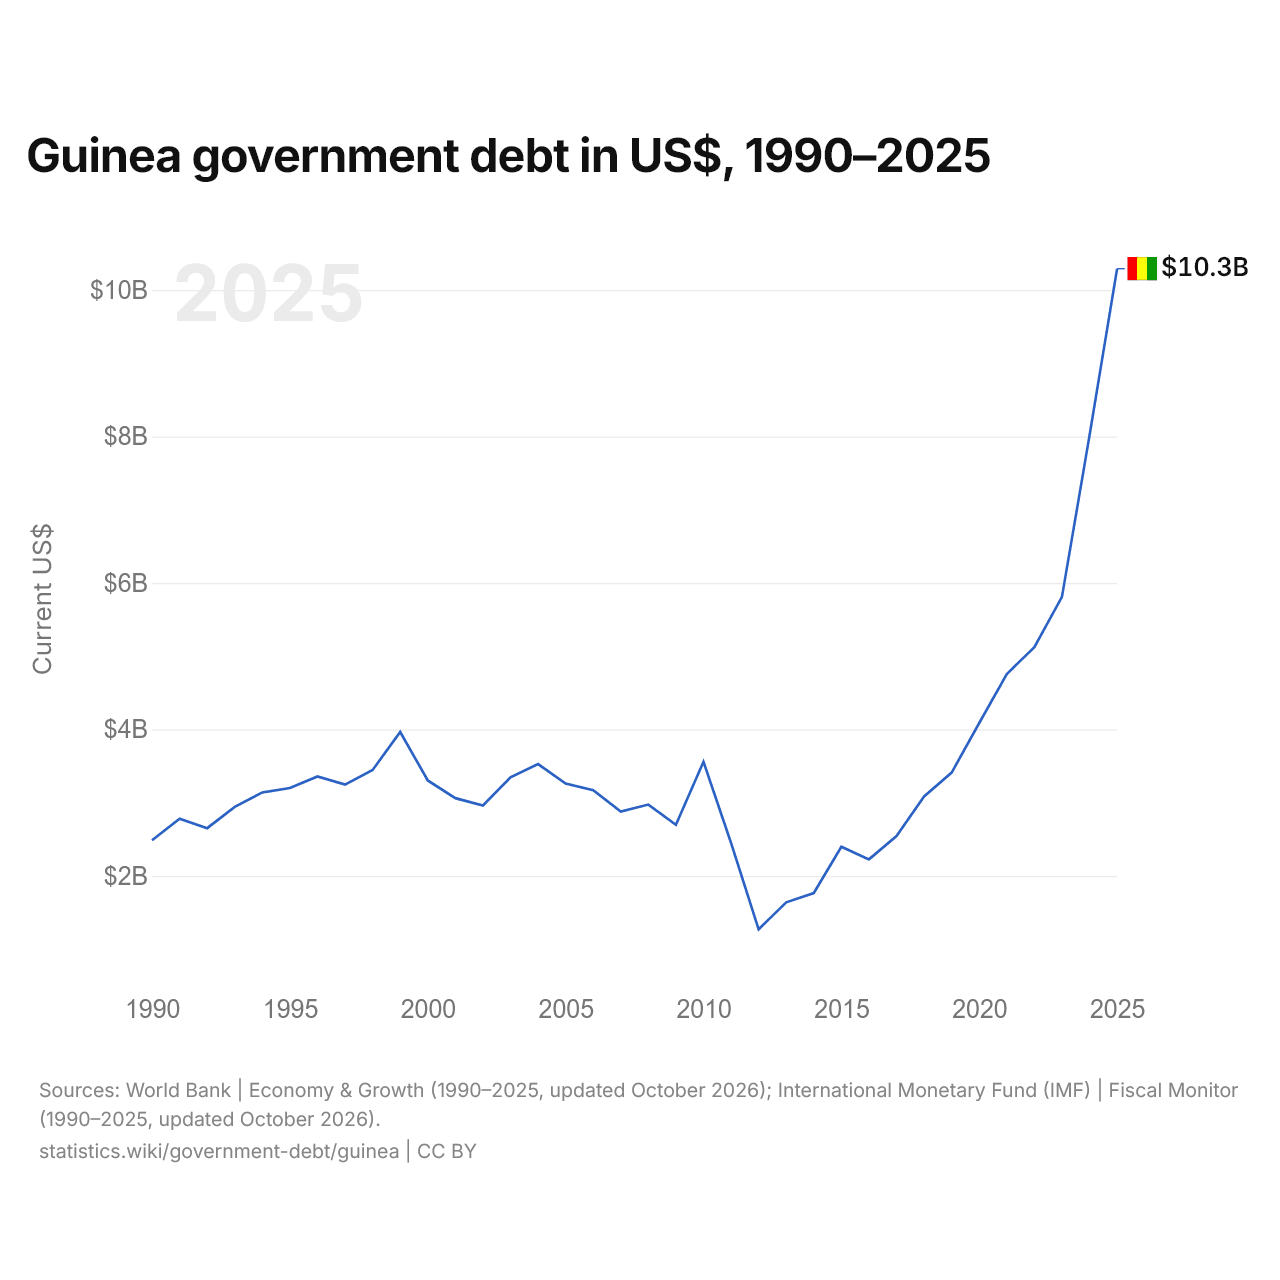
In 2025, Guinea's government debt was $10.3 billion, up from $2.49 billion in 1990. It was smallest in 2012, at $1.27 billion.
Guinea's government debt came to $681 per person in 2025.
Guinea in the world ranking by government debt, % of GDP, 2025







Compare Guinea government debt with other countries
Sources:
- International Monetary Fund (IMF) | Fiscal Monitor (1990–2025, updated October 2026)
- World Bank | Economy & Growth (1990–2025, updated October 2026)
Creative Commons Attribution (CC BY): you may copy, share, adapt and reuse this content, also commercially, as long as you credit statistics.wiki and note any changes you made. The sources listed above may have their own license terms.